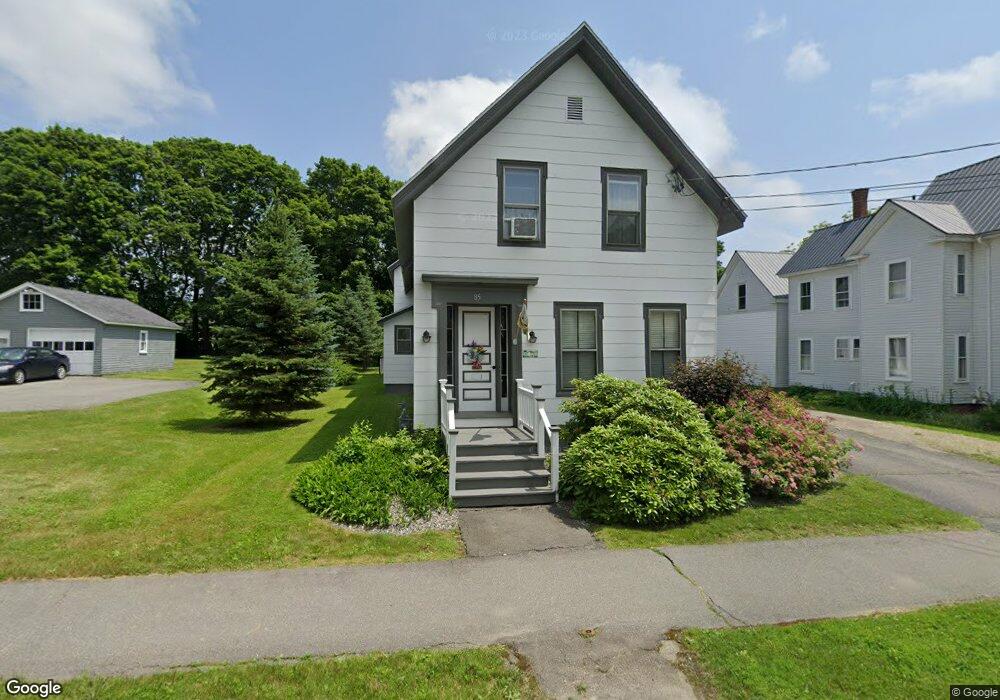
85 Maple St Bangor, ME 04401
Central Bangor NeighborhoodEstimated Value: $344,000 - $401,000
6
Beds
3
Baths
2,684
Sq Ft
$137/Sq Ft
Est. Value
About This Home
This home is located at 85 Maple St, Bangor, ME 04401 and is currently estimated at $368,333, approximately $137 per square foot. 85 Maple St is a home located in Penobscot County with nearby schools including Abraham Lincoln School, Mary Snow School, and William S. Cohen School.
Ownership History
Date
Name
Owned For
Owner Type
Purchase Details
Closed on
Jun 10, 2016
Sold by
Coglitore Frank S
Bought by
Coglitore Frank S and Coglitore Donna F
Current Estimated Value
Create a Home Valuation Report for This Property
The Home Valuation Report is an in-depth analysis detailing your home's value as well as a comparison with similar homes in the area
Home Values in the Area
Average Home Value in this Area
Purchase History
| Date | Buyer | Sale Price | Title Company |
|---|---|---|---|
| Coglitore Frank S | -- | -- |
Source: Public Records
Tax History
| Year | Tax Paid | Tax Assessment Tax Assessment Total Assessment is a certain percentage of the fair market value that is determined by local assessors to be the total taxable value of land and additions on the property. | Land | Improvement |
|---|---|---|---|---|
| 2024 | $5,559 | $299,700 | $27,500 | $272,200 |
| 2023 | $5,031 | $262,700 | $26,400 | $236,300 |
| 2022 | $4,584 | $224,700 | $26,400 | $198,300 |
| 2021 | $4,438 | $199,000 | $24,500 | $174,500 |
| 2020 | $4,072 | $175,500 | $24,000 | $151,500 |
| 2019 | $3,862 | $167,900 | $24,000 | $143,900 |
| 2018 | $3,693 | $160,900 | $24,000 | $136,900 |
| 2017 | $3,481 | $156,200 | $24,000 | $132,200 |
| 2016 | $3,440 | $152,900 | $24,000 | $128,900 |
| 2015 | $3,356 | $152,900 | $24,000 | $128,900 |
| 2014 | $3,263 | $149,700 | $24,000 | $125,700 |
| 2013 | $3,226 | $155,100 | $24,000 | $131,100 |
Source: Public Records
Map
Nearby Homes
Your Personal Tour Guide
Ask me questions while you tour the home.