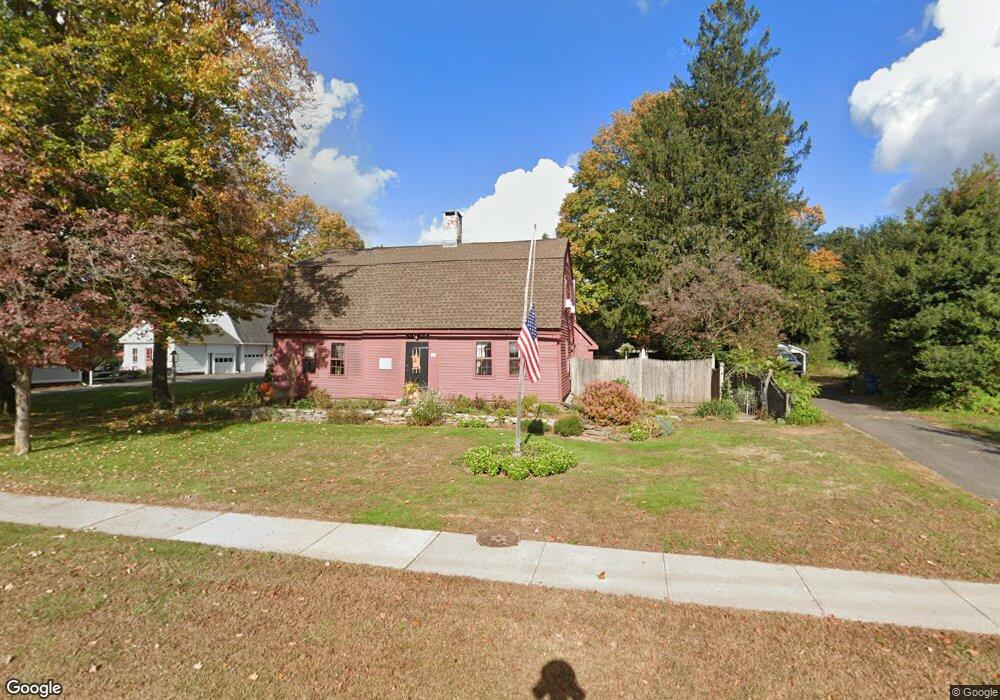
85 Maple St Ellington, CT 06029
Estimated Value: $390,000 - $525,000
3
Beds
2
Baths
2,432
Sq Ft
$191/Sq Ft
Est. Value
About This Home
This home is located at 85 Maple St, Ellington, CT 06029 and is currently estimated at $464,634, approximately $191 per square foot. 85 Maple St is a home located in Tolland County with nearby schools including Ellington High School.
Ownership History
Date
Name
Owned For
Owner Type
Purchase Details
Closed on
Oct 13, 2009
Sold by
Boyd Garth and Boyd Connie
Bought by
Lettieri Brian and Lettieri Lynn
Current Estimated Value
Home Financials for this Owner
Home Financials are based on the most recent Mortgage that was taken out on this home.
Original Mortgage
$172,000
Outstanding Balance
$112,657
Interest Rate
5.14%
Estimated Equity
$351,977
Purchase Details
Closed on
Nov 19, 1999
Sold by
Lyman James and Lyman Lisa
Bought by
Boyd Connie
Home Financials for this Owner
Home Financials are based on the most recent Mortgage that was taken out on this home.
Original Mortgage
$129,600
Interest Rate
7.76%
Purchase Details
Closed on
Mar 3, 1997
Sold by
Charbonneau Bruce and Charbonneau Susan
Bought by
Lyman James and Lyman Lisa
Home Financials for this Owner
Home Financials are based on the most recent Mortgage that was taken out on this home.
Original Mortgage
$105,000
Interest Rate
7.78%
Mortgage Type
Unknown
Create a Home Valuation Report for This Property
The Home Valuation Report is an in-depth analysis detailing your home's value as well as a comparison with similar homes in the area
Home Values in the Area
Average Home Value in this Area
Purchase History
| Date | Buyer | Sale Price | Title Company |
|---|---|---|---|
| Lettieri Brian | $215,000 | -- | |
| Boyd Connie | $162,000 | -- | |
| Lyman James | $140,000 | -- |
Source: Public Records
Mortgage History
| Date | Status | Borrower | Loan Amount |
|---|---|---|---|
| Open | Lyman James | $172,000 | |
| Previous Owner | Lyman James | $115,900 | |
| Previous Owner | Lyman James | $129,600 | |
| Previous Owner | Lyman James | $105,000 |
Source: Public Records
Tax History
| Year | Tax Paid | Tax Assessment Tax Assessment Total Assessment is a certain percentage of the fair market value that is determined by local assessors to be the total taxable value of land and additions on the property. | Land | Improvement |
|---|---|---|---|---|
| 2025 | $6,389 | $172,210 | $61,680 | $110,530 |
| 2024 | $6,200 | $172,210 | $61,680 | $110,530 |
| 2023 | $5,907 | $172,210 | $61,680 | $110,530 |
| 2022 | $5,597 | $172,210 | $61,680 | $110,530 |
| 2021 | $5,442 | $172,210 | $61,680 | $110,530 |
| 2020 | $5,908 | $181,240 | $59,620 | $121,620 |
| 2019 | $5,908 | $181,240 | $59,620 | $121,620 |
| 2016 | $5,528 | $181,240 | $59,620 | $121,620 |
| 2015 | $5,642 | $184,970 | $59,620 | $125,350 |
| 2014 | $5,309 | $184,970 | $59,620 | $125,350 |
Source: Public Records
Map
Nearby Homes
- 89 Maple St
- 58 Maple St
- 222 Mountain Rd
- 96 Muddy Brook Rd
- 41 Cider Mill Rd
- 6 Setting Sun Trail
- 2 Setting Sun Trail
- 37 Ellsworth Ln
- 178 Crystal Lake Rd
- 0 Porter Rd
- 254 Jobs Hill Rd
- 437 Somers Rd
- 4 Orchard Ave
- 0 Crane Rd Unit 24151873
- 24 West Rd Unit 44
- 42 Crane Rd
- 99 Davis Avenue Extension
- 31 Grant St
- 22 N Park St
- 140 Union St
Your Personal Tour Guide
Ask me questions while you tour the home.