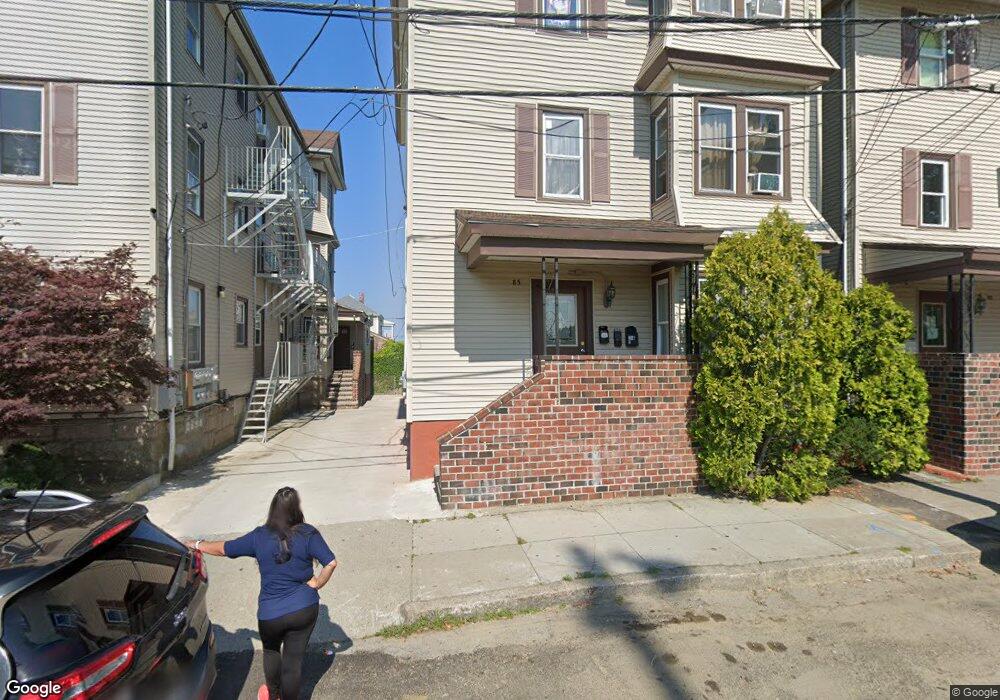
85 Mason St Fall River, MA 02723
Flint NeighborhoodEstimated Value: $530,000 - $597,000
6
Beds
3
Baths
2,568
Sq Ft
$219/Sq Ft
Est. Value
About This Home
This home is located at 85 Mason St, Fall River, MA 02723 and is currently estimated at $561,667, approximately $218 per square foot. 85 Mason St is a home located in Bristol County with nearby schools including Mary Fonseca Elementary School, Talbot Innovation School, and B M C Durfee High School.
Ownership History
Date
Name
Owned For
Owner Type
Purchase Details
Closed on
Oct 11, 2002
Sold by
Estacio Joao and Estacio Helena T
Bought by
85-89 Mason St Rt
Current Estimated Value
Home Financials for this Owner
Home Financials are based on the most recent Mortgage that was taken out on this home.
Original Mortgage
$495,000
Outstanding Balance
$208,738
Interest Rate
6.24%
Mortgage Type
Purchase Money Mortgage
Estimated Equity
$352,929
Create a Home Valuation Report for This Property
The Home Valuation Report is an in-depth analysis detailing your home's value as well as a comparison with similar homes in the area
Home Values in the Area
Average Home Value in this Area
Purchase History
| Date | Buyer | Sale Price | Title Company |
|---|---|---|---|
| 85-89 Mason St Rt | $275,000 | -- |
Source: Public Records
Mortgage History
| Date | Status | Borrower | Loan Amount |
|---|---|---|---|
| Open | 85-89 Mason St Rt | $495,000 |
Source: Public Records
Tax History
| Year | Tax Paid | Tax Assessment Tax Assessment Total Assessment is a certain percentage of the fair market value that is determined by local assessors to be the total taxable value of land and additions on the property. | Land | Improvement |
|---|---|---|---|---|
| 2025 | $5,028 | $439,100 | $105,500 | $333,600 |
| 2024 | $4,814 | $419,000 | $101,600 | $317,400 |
| 2023 | $4,191 | $341,600 | $83,900 | $257,700 |
| 2022 | $3,738 | $296,200 | $79,900 | $216,300 |
| 2021 | $3,552 | $256,800 | $76,000 | $180,800 |
| 2020 | $3,217 | $222,600 | $74,900 | $147,700 |
| 2019 | $2,767 | $189,800 | $72,200 | $117,600 |
| 2018 | $2,686 | $183,700 | $78,100 | $105,600 |
| 2017 | $2,521 | $180,100 | $74,500 | $105,600 |
| 2016 | $2,483 | $182,200 | $79,300 | $102,900 |
| 2015 | $2,383 | $182,200 | $79,300 | $102,900 |
| 2014 | $2,385 | $189,600 | $76,900 | $112,700 |
Source: Public Records
Map
Nearby Homes
- 70 Jencks St
- 88 Harrison St Unit 5
- 178 Thomas St
- 1244 Pleasant St
- 1155-1157 Pleasant St
- 165 Eastern Ave
- 150 Downing St
- 580 County St
- 129 County St
- 529 Eastern Ave
- 152 Alden St
- 25 Lebanon St Unit D
- 25 Lebanon St Unit C
- 31 Choate St
- 10 Carlisa Dr
- 756 County St
- 847 Pleasant St
- 144 Choate St
- 366 Alden St
- 84 Healy St
- 95 Mason St
- 67 Mason St
- 103 Mason St Unit 2 Rear
- 103 Mason St
- 68 Thomas St
- 96 Thomas St
- 62 Thomas St Unit 2
- 110 Thomas St Unit 3E
- 108 Thomas St
- 47 Mason St
- 58 Thomas St
- 48 Thomas St Unit 3
- 48 Thomas St Unit 1
- 48 Thomas St Unit 2
- 79 Thomas St Unit 1 SO
- 79 Thomas St
- 81 Thomas St
- 91 Thomas St
- 41 Mason St
- 97 Thomas St
Your Personal Tour Guide
Ask me questions while you tour the home.