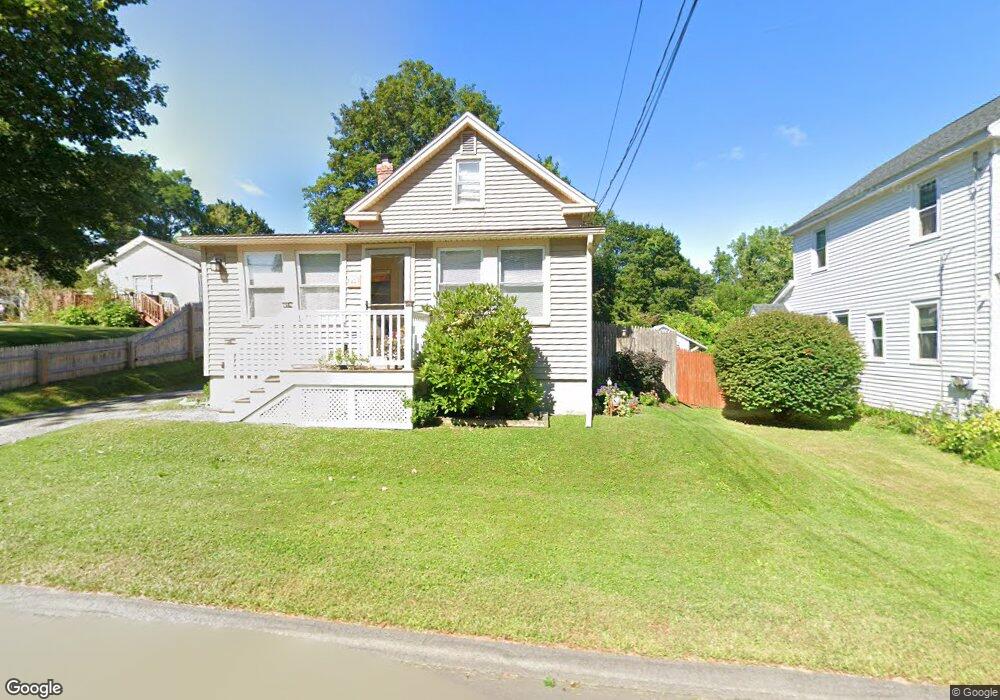
85 Mohegan St Pittsfield, MA 01201
Estimated Value: $191,910 - $250,000
2
Beds
1
Bath
1,300
Sq Ft
$171/Sq Ft
Est. Value
About This Home
This home is located at 85 Mohegan St, Pittsfield, MA 01201 and is currently estimated at $222,728, approximately $171 per square foot. 85 Mohegan St is a home located in Berkshire County with nearby schools including Silvio O. Conte Community School, John T. Reid Middle School, and Taconic High School.
Ownership History
Date
Name
Owned For
Owner Type
Purchase Details
Closed on
Jul 18, 2000
Sold by
Gilmore Michael and Gilmore Kara
Bought by
Taliaferro Frederick D and Taliaferro Edwina M
Current Estimated Value
Home Financials for this Owner
Home Financials are based on the most recent Mortgage that was taken out on this home.
Original Mortgage
$63,175
Interest Rate
8.5%
Mortgage Type
Purchase Money Mortgage
Purchase Details
Closed on
Jan 3, 1997
Sold by
Nuttall Grace G
Bought by
Gilmore Michael and Gilmore Kara
Create a Home Valuation Report for This Property
The Home Valuation Report is an in-depth analysis detailing your home's value as well as a comparison with similar homes in the area
Home Values in the Area
Average Home Value in this Area
Purchase History
| Date | Buyer | Sale Price | Title Company |
|---|---|---|---|
| Taliaferro Frederick D | $66,500 | -- | |
| Taliaferro Frederick D | $66,500 | -- | |
| Gilmore Michael | $30,000 | -- | |
| Gilmore Michael | $30,000 | -- |
Source: Public Records
Mortgage History
| Date | Status | Borrower | Loan Amount |
|---|---|---|---|
| Open | Gilmore Michael | $118,400 | |
| Closed | Gilmore Michael | $12,600 | |
| Closed | Gilmore Michael | $63,175 |
Source: Public Records
Tax History
| Year | Tax Paid | Tax Assessment Tax Assessment Total Assessment is a certain percentage of the fair market value that is determined by local assessors to be the total taxable value of land and additions on the property. | Land | Improvement |
|---|---|---|---|---|
| 2025 | $2,815 | $156,900 | $54,000 | $102,900 |
| 2024 | $2,797 | $151,600 | $54,000 | $97,600 |
| 2023 | $2,655 | $144,900 | $54,000 | $90,900 |
| 2022 | $2,422 | $130,500 | $51,800 | $78,700 |
| 2021 | $2,231 | $115,900 | $51,800 | $64,100 |
| 2020 | $2,075 | $105,300 | $43,200 | $62,100 |
| 2019 | $2,004 | $103,200 | $43,200 | $60,000 |
| 2018 | $2,025 | $101,200 | $43,200 | $58,000 |
| 2017 | $1,892 | $96,400 | $40,500 | $55,900 |
| 2016 | $1,784 | $95,100 | $40,500 | $54,600 |
| 2015 | $1,718 | $95,100 | $40,500 | $54,600 |
Source: Public Records
Map
Nearby Homes
Your Personal Tour Guide
Ask me questions while you tour the home.