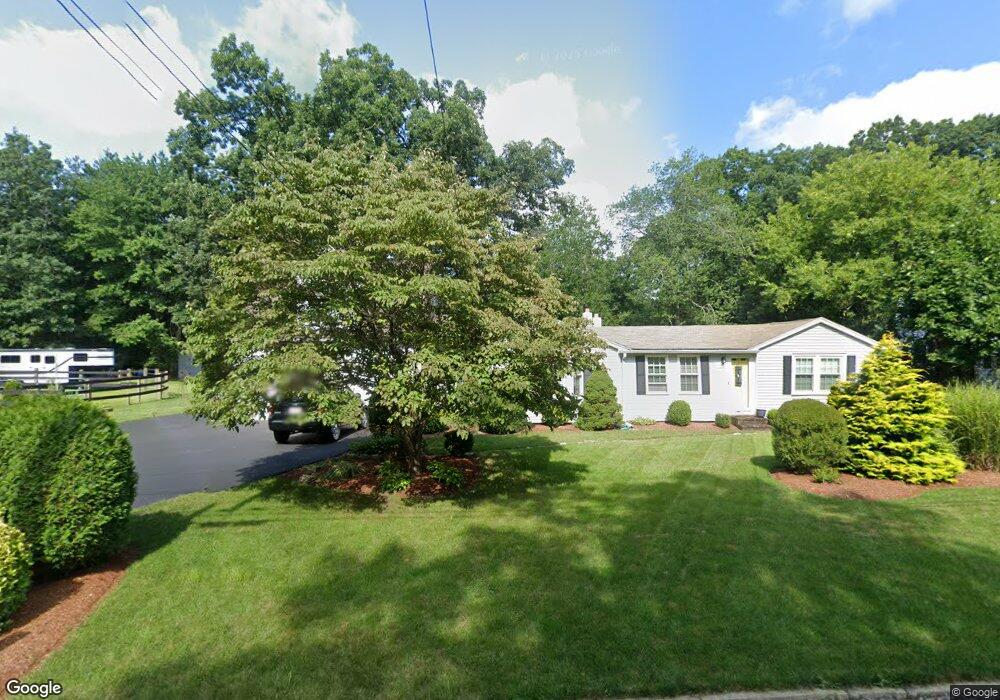
85 Morse St Foxboro, MA 02035
Estimated Value: $601,664 - $697,000
3
Beds
3
Baths
1,663
Sq Ft
$397/Sq Ft
Est. Value
About This Home
This home is located at 85 Morse St, Foxboro, MA 02035 and is currently estimated at $660,166, approximately $396 per square foot. 85 Morse St is a home located in Norfolk County with nearby schools including Foxborough High School, Hands-On-Montessori School, and St Mary's Catholic School.
Ownership History
Date
Name
Owned For
Owner Type
Purchase Details
Closed on
Oct 17, 2024
Sold by
Imbaro Philip C and Imbaro Joyce M
Bought by
Imbaro Ft and Imbaro
Current Estimated Value
Purchase Details
Closed on
Sep 22, 1983
Bought by
Imbaro Philip C and Imbaro Joyce M
Create a Home Valuation Report for This Property
The Home Valuation Report is an in-depth analysis detailing your home's value as well as a comparison with similar homes in the area
Home Values in the Area
Average Home Value in this Area
Purchase History
| Date | Buyer | Sale Price | Title Company |
|---|---|---|---|
| Imbaro Ft | -- | None Available | |
| Imbaro Ft | -- | None Available | |
| Imbaro Philip C | -- | -- |
Source: Public Records
Mortgage History
| Date | Status | Borrower | Loan Amount |
|---|---|---|---|
| Previous Owner | Imbaro Philip C | $75,000 |
Source: Public Records
Tax History
| Year | Tax Paid | Tax Assessment Tax Assessment Total Assessment is a certain percentage of the fair market value that is determined by local assessors to be the total taxable value of land and additions on the property. | Land | Improvement |
|---|---|---|---|---|
| 2025 | $6,747 | $510,400 | $237,100 | $273,300 |
| 2024 | $6,689 | $495,100 | $255,300 | $239,800 |
| 2023 | $6,234 | $438,700 | $243,300 | $195,400 |
| 2022 | $6,103 | $420,300 | $218,400 | $201,900 |
| 2021 | $5,958 | $404,200 | $207,500 | $196,700 |
| 2020 | $5,679 | $389,800 | $207,500 | $182,300 |
| 2019 | $5,643 | $383,900 | $208,000 | $175,900 |
| 2018 | $5,280 | $362,400 | $197,700 | $164,700 |
| 2017 | $5,208 | $346,300 | $194,400 | $151,900 |
| 2016 | $5,194 | $350,500 | $187,300 | $163,200 |
| 2015 | $4,651 | $306,200 | $139,800 | $166,400 |
| 2014 | $4,638 | $309,400 | $139,800 | $169,600 |
Source: Public Records
Map
Nearby Homes
- 261 East St
- 619 N Main St
- 9 Independence Dr Unit 9
- 25 Kingman Ave
- 81 Chilson Ave
- 356 Central St
- 22 Pleasant St Unit B
- 122 Samoset Ave
- 233 Central St
- 266 N Main St Unit 3
- 46 Hope St
- 150 Rumford Ave Unit 110
- 26 Fredric Ln
- 166 Chauncy St
- 13 Summerville Rd Unit 13
- 28 Court St
- 165 Chestnut St Unit 2
- 157 Central St
- 631 East St Unit L101
- 3 Willow St
Your Personal Tour Guide
Ask me questions while you tour the home.