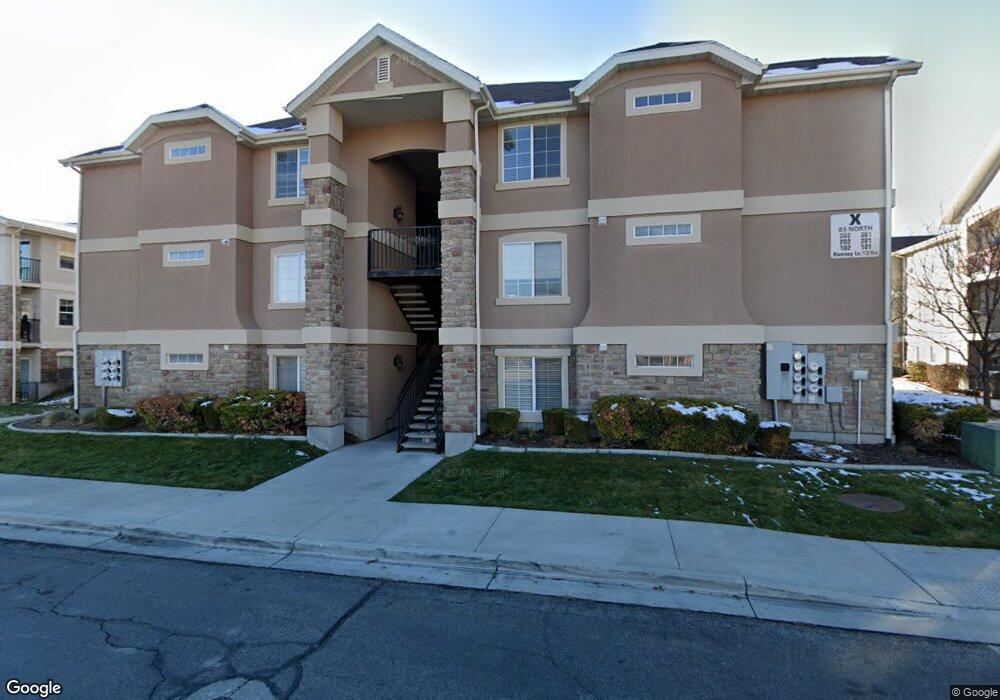
85 N Romney Ln Unit X101 Pleasant Grove, UT 84062
Estimated Value: $330,000 - $342,000
3
Beds
2
Baths
1,329
Sq Ft
$253/Sq Ft
Est. Value
About This Home
This home is located at 85 N Romney Ln Unit X101, Pleasant Grove, UT 84062 and is currently estimated at $336,308, approximately $253 per square foot. 85 N Romney Ln Unit X101 is a home located in Utah County with nearby schools including Mount Mahogany School, Pleasant Grove Junior High School, and Pleasant Grove High School.
Ownership History
Date
Name
Owned For
Owner Type
Purchase Details
Closed on
Oct 12, 2018
Sold by
Deida Gloria
Bought by
Palacio Maria Jose Hernandez
Current Estimated Value
Purchase Details
Closed on
May 19, 2017
Sold by
White Adrienne Marie and White Jones Douglas
Bought by
Delda Gloria
Purchase Details
Closed on
Apr 26, 2007
Sold by
Cambria Development Lc
Bought by
White Adrienne Marie and White Jones Douglas
Home Financials for this Owner
Home Financials are based on the most recent Mortgage that was taken out on this home.
Original Mortgage
$155,398
Interest Rate
6.11%
Mortgage Type
FHA
Purchase Details
Closed on
Apr 23, 2007
Sold by
Ricks Artel and Ricks Focha B
Bought by
Cambria Development Lc
Home Financials for this Owner
Home Financials are based on the most recent Mortgage that was taken out on this home.
Original Mortgage
$155,398
Interest Rate
6.11%
Mortgage Type
FHA
Create a Home Valuation Report for This Property
The Home Valuation Report is an in-depth analysis detailing your home's value as well as a comparison with similar homes in the area
Home Values in the Area
Average Home Value in this Area
Purchase History
| Date | Buyer | Sale Price | Title Company |
|---|---|---|---|
| Palacio Maria Jose Hernandez | -- | None Available | |
| Delda Gloria | -- | Cottonwood Title Ins Agency | |
| White Adrienne Marie | -- | Affiliated First Title Comp | |
| Cambria Development Lc | -- | Affiliated First Title Comp |
Source: Public Records
Mortgage History
| Date | Status | Borrower | Loan Amount |
|---|---|---|---|
| Previous Owner | White Adrienne Marie | $155,398 |
Source: Public Records
Tax History Compared to Growth
Tax History
| Year | Tax Paid | Tax Assessment Tax Assessment Total Assessment is a certain percentage of the fair market value that is determined by local assessors to be the total taxable value of land and additions on the property. | Land | Improvement |
|---|---|---|---|---|
| 2025 | $1,479 | $173,580 | $35,100 | $280,500 |
| 2024 | $1,479 | $176,495 | $0 | $0 |
| 2023 | $1,429 | $174,570 | $0 | $0 |
| 2022 | $1,390 | $169,015 | $0 | $0 |
| 2021 | $1,221 | $226,000 | $27,100 | $198,900 |
| 2020 | $1,143 | $207,400 | $24,900 | $182,500 |
| 2019 | $1,005 | $188,500 | $22,000 | $166,500 |
| 2018 | $902 | $160,000 | $19,200 | $140,800 |
| 2017 | $833 | $78,650 | $0 | $0 |
| 2016 | $862 | $78,650 | $0 | $0 |
| 2015 | $911 | $78,650 | $0 | $0 |
| 2014 | $829 | $70,950 | $0 | $0 |
Source: Public Records
Map
Nearby Homes
- 123 N Romney Ln Unit 103
- 1249 W Cambria Dr Unit 101
- 150 N 1300 W
- 1267 W 20 S
- 1406 W 50 N
- 1429 W 110 N
- 165 S Pleasant Blvd Unit 45
- 1512 W 50 N
- 1130 W State Rd
- 1542 W 110 N
- 1559 W 50 N
- 1541 W 250 N
- 1525 W 300 N
- 1593 W 220 N
- 1584 W 110 N
- 289 S 1000 W Unit 203
- 317 S 1000 W Unit 104
- 293 N 1630 W
- 278 S 740 W
- 1598 W 220 N
- 85 N Romney Ln Unit X 303
- 85 N Romney Ln Unit X-103
- 85 N Romney Ln Unit X304
- 85 N Romney Ln Unit 301
- 85 N Romney Ln Unit 302
- 85 N Romney Ln Unit X 104
- 85 N Romney Ln Unit X-303
- 85 N Romney Ln Unit 203
- 85 N Romney Ln Unit X104
- 85 N Romney Ln Unit 204
- 85 N Romney Ln Unit X 201
- 85 N Romney Ln Unit 203
- 85 N Romney Ln
- 1136 W Spencer Rd Unit 301
- 1136 W Spencer Rd Unit Y-104
- 1136 W Spencer Rd Unit Y204
- 1136 W Spencer Rd Unit Y103
- 1136 W Spencer Rd Unit Y203
- 1136 W Spencer Rd Unit Y 101
- 1136 W Spencer Rd