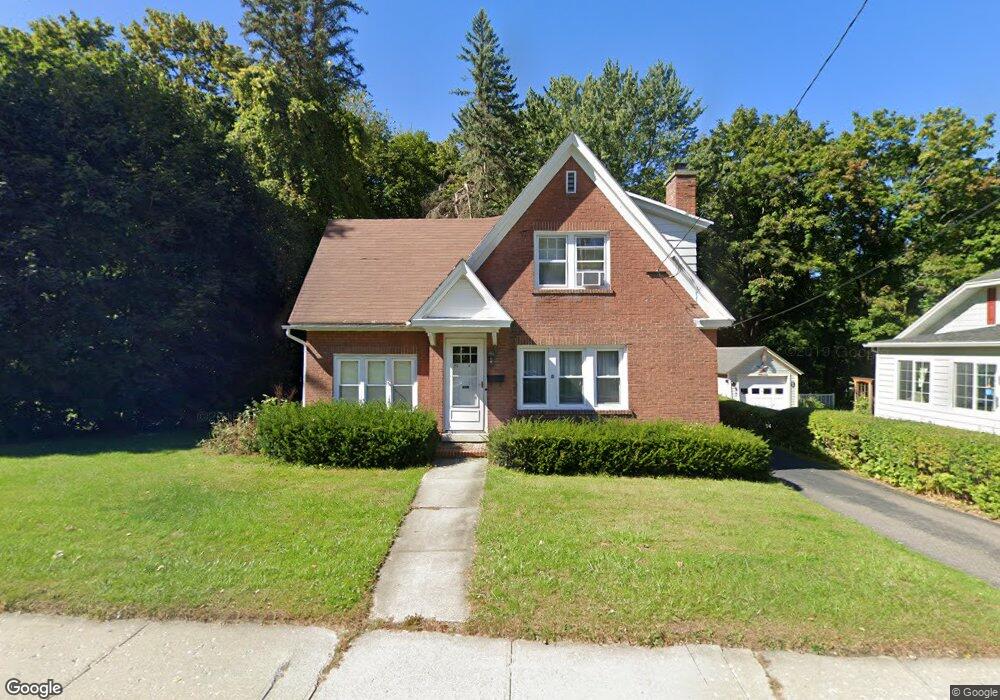
85 Notch Rd North Adams, MA 01247
Estimated Value: $245,000 - $260,000
3
Beds
1
Bath
1,531
Sq Ft
$165/Sq Ft
Est. Value
About This Home
This home is located at 85 Notch Rd, North Adams, MA 01247 and is currently estimated at $253,229, approximately $165 per square foot. 85 Notch Rd is a home located in Berkshire County with nearby schools including Greylock Elementary School and Drury High School.
Ownership History
Date
Name
Owned For
Owner Type
Purchase Details
Closed on
Sep 18, 2008
Sold by
Demeo Anne C and Carlow Mary Noella
Bought by
Taskin Richard S
Current Estimated Value
Home Financials for this Owner
Home Financials are based on the most recent Mortgage that was taken out on this home.
Original Mortgage
$98,000
Interest Rate
6.54%
Mortgage Type
Purchase Money Mortgage
Create a Home Valuation Report for This Property
The Home Valuation Report is an in-depth analysis detailing your home's value as well as a comparison with similar homes in the area
Home Values in the Area
Average Home Value in this Area
Purchase History
| Date | Buyer | Sale Price | Title Company |
|---|---|---|---|
| Taskin Richard S | $122,500 | -- | |
| Taskin Richard S | $122,500 | -- |
Source: Public Records
Mortgage History
| Date | Status | Borrower | Loan Amount |
|---|---|---|---|
| Open | Taskin Richard S | $119,000 | |
| Closed | Taskin Richard S | $98,000 |
Source: Public Records
Tax History
| Year | Tax Paid | Tax Assessment Tax Assessment Total Assessment is a certain percentage of the fair market value that is determined by local assessors to be the total taxable value of land and additions on the property. | Land | Improvement |
|---|---|---|---|---|
| 2025 | $3,654 | $218,700 | $44,800 | $173,900 |
| 2024 | $4,168 | $243,200 | $41,000 | $202,200 |
| 2023 | $4,091 | $231,500 | $41,000 | $190,500 |
| 2022 | $3,702 | $199,800 | $41,000 | $158,800 |
| 2021 | $3,445 | $185,100 | $38,000 | $147,100 |
| 2020 | $3,223 | $173,100 | $37,700 | $135,400 |
| 2019 | $3,031 | $158,600 | $34,800 | $123,800 |
| 2018 | $2,906 | $158,100 | $36,600 | $121,500 |
| 2017 | $2,767 | $156,600 | $36,300 | $120,300 |
| 2016 | $2,854 | $164,100 | $36,300 | $127,800 |
| 2015 | $2,739 | $164,100 | $36,300 | $127,800 |
Source: Public Records
Map
Nearby Homes
- 64 Notch Rd
- 51 Notch Rd
- 457 W Main St
- 34 Goodrich St
- 19 Fairgrounds Ave
- 447 Notch Rd
- 0 Reservoir Rd
- L16 Reservoir Rd
- 0 Reservoir Rd Unit 16
- 63 Addison St
- 86 W Main St
- 505 Barbour St
- 520 State Rd Unit 309
- 520 State Rd Unit 303
- 520 State Rd Unit 402
- 520 State Rd Unit 208
- 66 Lyman St
- 301 Walnut St
- 286 Walnut St
- 131 State St
Your Personal Tour Guide
Ask me questions while you tour the home.