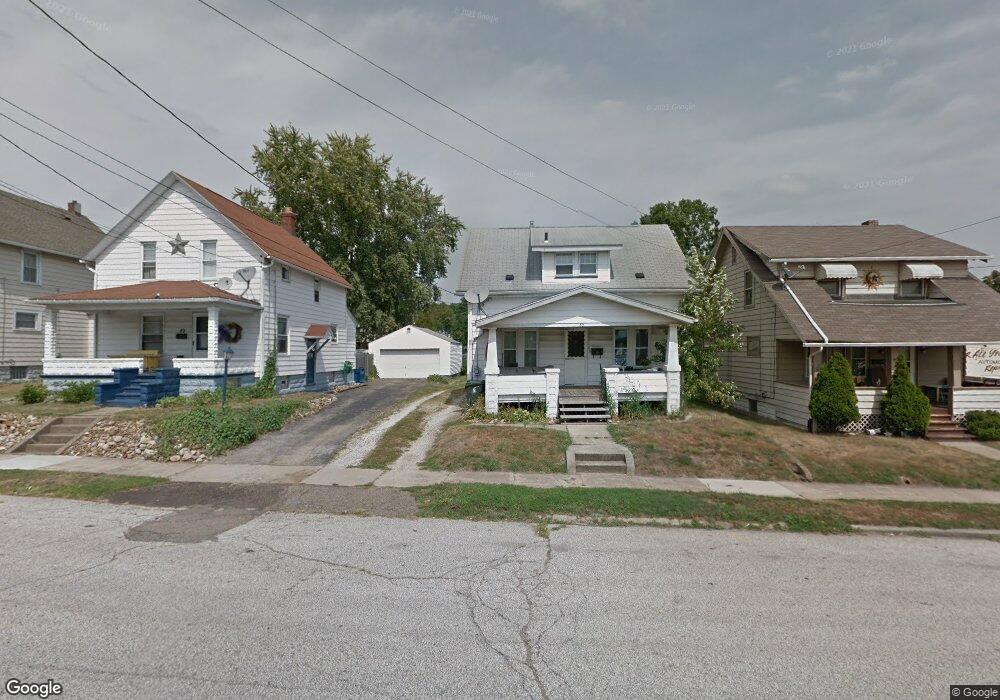
85 Oakwood St Barberton, OH 44203
North Barberton NeighborhoodEstimated Value: $113,000 - $128,000
2
Beds
1
Bath
1,050
Sq Ft
$112/Sq Ft
Est. Value
About This Home
This home is located at 85 Oakwood St, Barberton, OH 44203 and is currently estimated at $117,591, approximately $111 per square foot. 85 Oakwood St is a home located in Summit County with nearby schools including Barberton Middle School, Barberton Intermediate School 3-5, and Barberton High School.
Ownership History
Date
Name
Owned For
Owner Type
Purchase Details
Closed on
Jun 14, 2006
Sold by
Troyer Coleen R
Bought by
Soucek Christianne M
Current Estimated Value
Home Financials for this Owner
Home Financials are based on the most recent Mortgage that was taken out on this home.
Original Mortgage
$74,168
Outstanding Balance
$43,873
Interest Rate
6.68%
Mortgage Type
FHA
Estimated Equity
$73,718
Purchase Details
Closed on
Jun 22, 2003
Sold by
Ciarlariello John A and Ciarlariello Pamela A
Bought by
Troyer Coleen R
Home Financials for this Owner
Home Financials are based on the most recent Mortgage that was taken out on this home.
Original Mortgage
$70,887
Interest Rate
5.51%
Mortgage Type
FHA
Purchase Details
Closed on
Mar 13, 2003
Sold by
Bille John E
Bought by
Ciarlariello John A and Ciarlariello Pamela A
Home Financials for this Owner
Home Financials are based on the most recent Mortgage that was taken out on this home.
Original Mortgage
$150,000
Interest Rate
6%
Mortgage Type
New Conventional
Create a Home Valuation Report for This Property
The Home Valuation Report is an in-depth analysis detailing your home's value as well as a comparison with similar homes in the area
Home Values in the Area
Average Home Value in this Area
Purchase History
| Date | Buyer | Sale Price | Title Company |
|---|---|---|---|
| Soucek Christianne M | $75,000 | Land America-Lawyers Title | |
| Troyer Coleen R | $72,000 | Approved Statewide Title Age | |
| Ciarlariello John A | $52,000 | -- |
Source: Public Records
Mortgage History
| Date | Status | Borrower | Loan Amount |
|---|---|---|---|
| Open | Soucek Christianne M | $74,168 | |
| Previous Owner | Troyer Coleen R | $70,887 | |
| Previous Owner | Ciarlariello John A | $150,000 |
Source: Public Records
Tax History Compared to Growth
Tax History
| Year | Tax Paid | Tax Assessment Tax Assessment Total Assessment is a certain percentage of the fair market value that is determined by local assessors to be the total taxable value of land and additions on the property. | Land | Improvement |
|---|---|---|---|---|
| 2025 | $1,647 | $32,946 | $8,169 | $24,777 |
| 2024 | $1,647 | $32,946 | $8,169 | $24,777 |
| 2023 | $1,647 | $32,946 | $8,169 | $24,777 |
| 2022 | $1,257 | $21,806 | $5,338 | $16,468 |
| 2021 | $1,256 | $21,806 | $5,338 | $16,468 |
| 2020 | $1,229 | $21,810 | $5,340 | $16,470 |
| 2019 | $1,106 | $17,780 | $3,300 | $14,480 |
| 2018 | $1,089 | $17,780 | $3,300 | $14,480 |
| 2017 | $1,103 | $17,780 | $3,300 | $14,480 |
| 2016 | $1,106 | $17,780 | $3,300 | $14,480 |
| 2015 | $1,103 | $17,780 | $3,300 | $14,480 |
| 2014 | $1,097 | $17,780 | $3,300 | $14,480 |
| 2013 | $1,114 | $18,710 | $3,300 | $15,410 |
Source: Public Records
Map
Nearby Homes
- 76 Hazelwood Ave
- 103 & 103 1/2 Fernwood Ave
- 0 Romig Ave
- 117 Fernwood Ave
- 1150 Wooster Rd N
- 143 Glenn St
- 30 W Hiram St
- 277 Glenn St
- 1315 Kohler Ave
- 818 N Summit St
- 1295 Kohler Ave
- 2518 30th St SW
- 1266 Kohler Ave
- 172 & 173 Belcher Ave
- 2714 Romig Rd
- 1392 Belcher Ave
- 103 Mitchell St
- 1356 Carnegie Ave
- 1253 Sevilla Ave
- 1515 Grand Blvd
- 81 Oakwood St
- 89 Oakwood St
- 93 Oakwood St
- 79 Oakwood St
- 97 Oakwood St
- 84 Hazelwood Ave
- 80 Hazelwood Ave
- 1078 Wooster Rd N
- 88 Oakwood St
- 94 Hazelwood Ave
- 88 Hazelwood Ave
- 103 Oakwood St
- 1042 Wooster Rd N
- 92 Oakwood St
- 1082 Wooster Rd N
- 98 Oakwood St
- 107 Oakwood St
- 102 Hazelwood Ave
- 102 Oakwood St
- 108 Hazelwood Ave