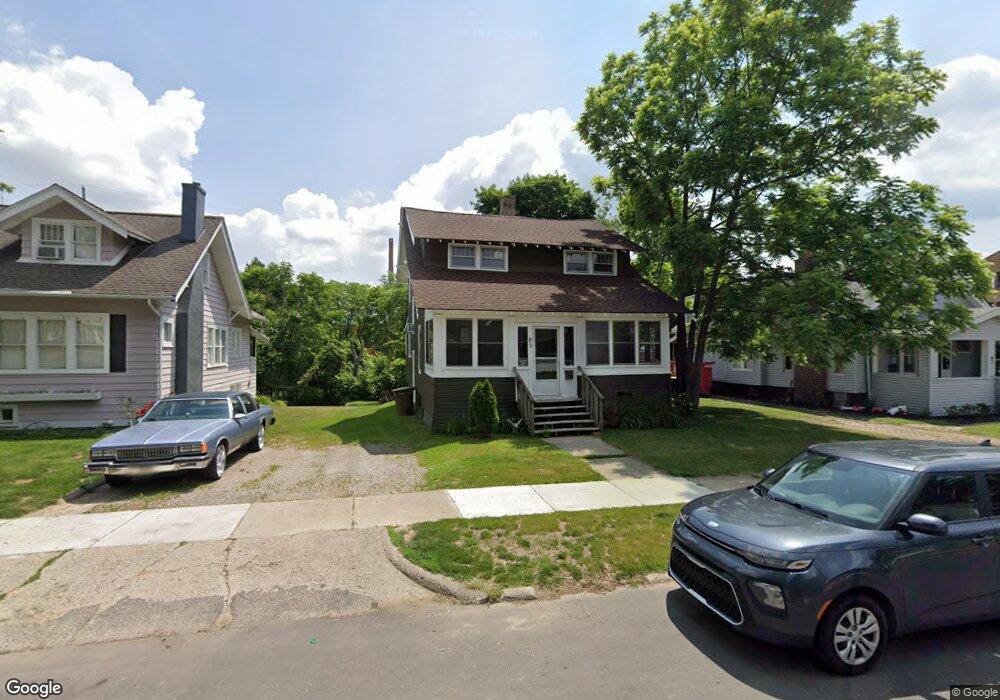
85 Oneida St Pontiac, MI 48341
Estimated Value: $173,000 - $200,000
3
Beds
1
Bath
1,506
Sq Ft
$122/Sq Ft
Est. Value
About This Home
This home is located at 85 Oneida St, Pontiac, MI 48341 and is currently estimated at $184,462, approximately $122 per square foot. 85 Oneida St is a home located in Oakland County with nearby schools including Walt Whitman Elementary School, Pontiac Middle School, and Pontiac High School.
Ownership History
Date
Name
Owned For
Owner Type
Purchase Details
Closed on
Dec 12, 2017
Sold by
Blair Mary L and Webb Mary L
Bought by
Coon Eric
Current Estimated Value
Purchase Details
Closed on
Mar 2, 2004
Sold by
Deutsche Bank National Trust Co
Bought by
Webb James R and Webb Mary L
Home Financials for this Owner
Home Financials are based on the most recent Mortgage that was taken out on this home.
Original Mortgage
$875,000
Interest Rate
5.74%
Mortgage Type
Purchase Money Mortgage
Purchase Details
Closed on
Aug 17, 2000
Sold by
Webb James R
Bought by
Blair Mary L
Create a Home Valuation Report for This Property
The Home Valuation Report is an in-depth analysis detailing your home's value as well as a comparison with similar homes in the area
Home Values in the Area
Average Home Value in this Area
Purchase History
| Date | Buyer | Sale Price | Title Company |
|---|---|---|---|
| Coon Eric | $37,000 | None Available | |
| Webb James R | $38,700 | -- | |
| Blair Mary L | -- | -- |
Source: Public Records
Mortgage History
| Date | Status | Borrower | Loan Amount |
|---|---|---|---|
| Previous Owner | Webb James R | $875,000 |
Source: Public Records
Tax History Compared to Growth
Tax History
| Year | Tax Paid | Tax Assessment Tax Assessment Total Assessment is a certain percentage of the fair market value that is determined by local assessors to be the total taxable value of land and additions on the property. | Land | Improvement |
|---|---|---|---|---|
| 2024 | $1,191 | $64,170 | $0 | $0 |
| 2023 | $1,135 | $55,820 | $0 | $0 |
| 2022 | $1,165 | $50,270 | $0 | $0 |
| 2021 | $1,131 | $42,210 | $0 | $0 |
| 2020 | $1,031 | $37,540 | $0 | $0 |
| 2019 | $1,103 | $31,910 | $0 | $0 |
| 2018 | $1,064 | $26,920 | $0 | $0 |
| 2017 | $2,214 | $24,330 | $0 | $0 |
| 2016 | $1,097 | $21,650 | $0 | $0 |
| 2015 | -- | $20,180 | $0 | $0 |
| 2014 | -- | $18,580 | $0 | $0 |
| 2011 | -- | $24,580 | $0 | $0 |
Source: Public Records
Map
Nearby Homes