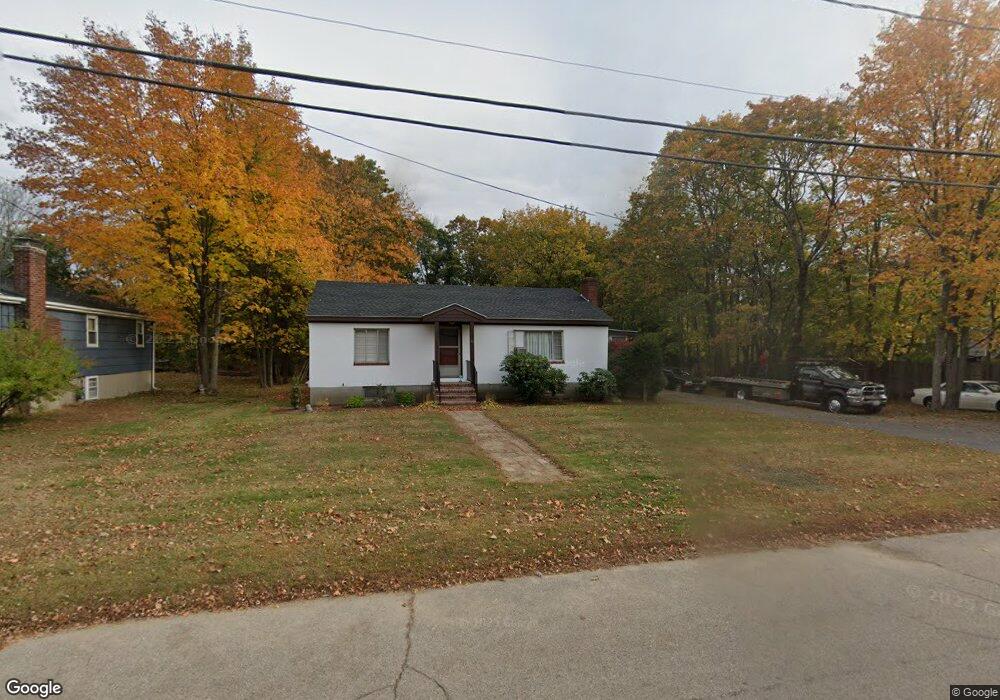
85 Parker Ave Brockton, MA 02302
Estimated Value: $382,000 - $472,020
2
Beds
1
Bath
1,040
Sq Ft
$423/Sq Ft
Est. Value
About This Home
This home is located at 85 Parker Ave, Brockton, MA 02302 and is currently estimated at $439,505, approximately $422 per square foot. 85 Parker Ave is a home located in Plymouth County with nearby schools including Davis K-8 School, John F. Kennedy Elementary School, and South Middle School.
Ownership History
Date
Name
Owned For
Owner Type
Purchase Details
Closed on
Dec 14, 2001
Sold by
Dearth Thomas H and Dearth Shirley L
Bought by
Espinola Maria C and Lagrange Randy
Current Estimated Value
Home Financials for this Owner
Home Financials are based on the most recent Mortgage that was taken out on this home.
Original Mortgage
$162,476
Interest Rate
6.6%
Mortgage Type
Purchase Money Mortgage
Create a Home Valuation Report for This Property
The Home Valuation Report is an in-depth analysis detailing your home's value as well as a comparison with similar homes in the area
Home Values in the Area
Average Home Value in this Area
Purchase History
| Date | Buyer | Sale Price | Title Company |
|---|---|---|---|
| Espinola Maria C | $168,500 | -- |
Source: Public Records
Mortgage History
| Date | Status | Borrower | Loan Amount |
|---|---|---|---|
| Open | Espinola Maria C | $48,900 | |
| Open | Espinola Maria C | $255,000 | |
| Closed | Espinola Maria C | $225,000 | |
| Closed | Espinola Maria C | $162,476 |
Source: Public Records
Tax History Compared to Growth
Tax History
| Year | Tax Paid | Tax Assessment Tax Assessment Total Assessment is a certain percentage of the fair market value that is determined by local assessors to be the total taxable value of land and additions on the property. | Land | Improvement |
|---|---|---|---|---|
| 2025 | $4,974 | $410,700 | $177,800 | $232,900 |
| 2024 | $4,884 | $406,300 | $177,800 | $228,500 |
| 2023 | $4,677 | $360,300 | $130,600 | $229,700 |
| 2022 | $4,557 | $326,200 | $118,700 | $207,500 |
| 2021 | $4,167 | $287,400 | $105,500 | $181,900 |
| 2020 | $4,271 | $281,900 | $91,900 | $190,000 |
| 2019 | $4,157 | $267,500 | $87,900 | $179,600 |
| 2018 | $3,570 | $222,300 | $87,900 | $134,400 |
| 2017 | $3,404 | $211,400 | $87,900 | $123,500 |
| 2016 | $3,371 | $194,200 | $84,300 | $109,900 |
| 2015 | $3,029 | $166,900 | $84,300 | $82,600 |
| 2014 | $3,031 | $167,200 | $84,300 | $82,900 |
Source: Public Records
Map
Nearby Homes