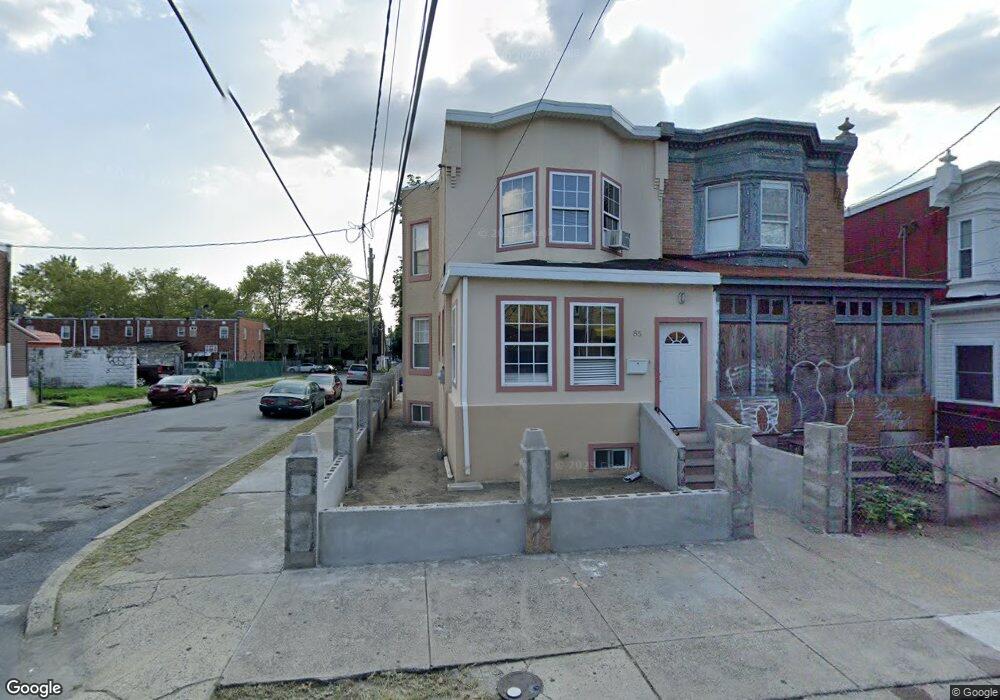
85 S 27th St Camden, NJ 08105
Marlton NeighborhoodEstimated Value: $147,000 - $185,000
--
Bed
--
Bath
1,429
Sq Ft
$115/Sq Ft
Est. Value
About This Home
This home is located at 85 S 27th St, Camden, NJ 08105 and is currently estimated at $163,715, approximately $114 per square foot. 85 S 27th St is a home located in Camden County with nearby schools including Alfred Cramer College Preparatory Lab School, Eastside High School, and St Joseph Pro-Cathedral School.
Ownership History
Date
Name
Owned For
Owner Type
Purchase Details
Closed on
Jul 12, 2007
Sold by
Caba Luis A
Bought by
Collado Rafael A
Current Estimated Value
Home Financials for this Owner
Home Financials are based on the most recent Mortgage that was taken out on this home.
Original Mortgage
$88,711
Outstanding Balance
$56,253
Interest Rate
6.78%
Mortgage Type
FHA
Estimated Equity
$107,462
Purchase Details
Closed on
Oct 5, 1994
Sold by
Flecha Santiago
Bought by
Laba Luis
Create a Home Valuation Report for This Property
The Home Valuation Report is an in-depth analysis detailing your home's value as well as a comparison with similar homes in the area
Home Values in the Area
Average Home Value in this Area
Purchase History
| Date | Buyer | Sale Price | Title Company |
|---|---|---|---|
| Collado Rafael A | $90,000 | -- | |
| Laba Luis | $15,000 | -- |
Source: Public Records
Mortgage History
| Date | Status | Borrower | Loan Amount |
|---|---|---|---|
| Open | Collado Rafael A | $88,711 |
Source: Public Records
Tax History Compared to Growth
Tax History
| Year | Tax Paid | Tax Assessment Tax Assessment Total Assessment is a certain percentage of the fair market value that is determined by local assessors to be the total taxable value of land and additions on the property. | Land | Improvement |
|---|---|---|---|---|
| 2025 | $2,487 | $70,200 | $19,000 | $51,200 |
| 2024 | $2,404 | $70,200 | $19,000 | $51,200 |
| 2023 | $2,404 | $70,200 | $19,000 | $51,200 |
| 2022 | $2,359 | $70,200 | $19,000 | $51,200 |
| 2021 | $2,351 | $70,200 | $19,000 | $51,200 |
| 2020 | $2,232 | $70,200 | $19,000 | $51,200 |
| 2019 | $2,138 | $70,200 | $19,000 | $51,200 |
| 2018 | $1,351 | $44,600 | $19,000 | $25,600 |
| 2017 | $1,318 | $44,600 | $19,000 | $25,600 |
| 2016 | $1,276 | $44,600 | $19,000 | $25,600 |
| 2015 | $1,228 | $44,600 | $19,000 | $25,600 |
| 2014 | $1,199 | $44,600 | $19,000 | $25,600 |
Source: Public Records
Map
Nearby Homes
- 2598 Baird Blvd
- 154 Eutaw Ave
- 2707 Westfield Ave
- 2709 Westfield Ave
- 2621 Westfield Ave
- 100 E 28th St
- 2817 Westfield Ave
- 32 N 25th St
- 2937 Carman St
- 341 Marlton Ave
- 2934 Cramer St
- 41 N 24th St
- 420 Boyd St
- 355 S 27th St
- 3027 Morrison St
- 127 N 23rd St
- 403 N 29th St
- 2933 Royden St
- 444 Pfeiffer St
- 477 Rand St