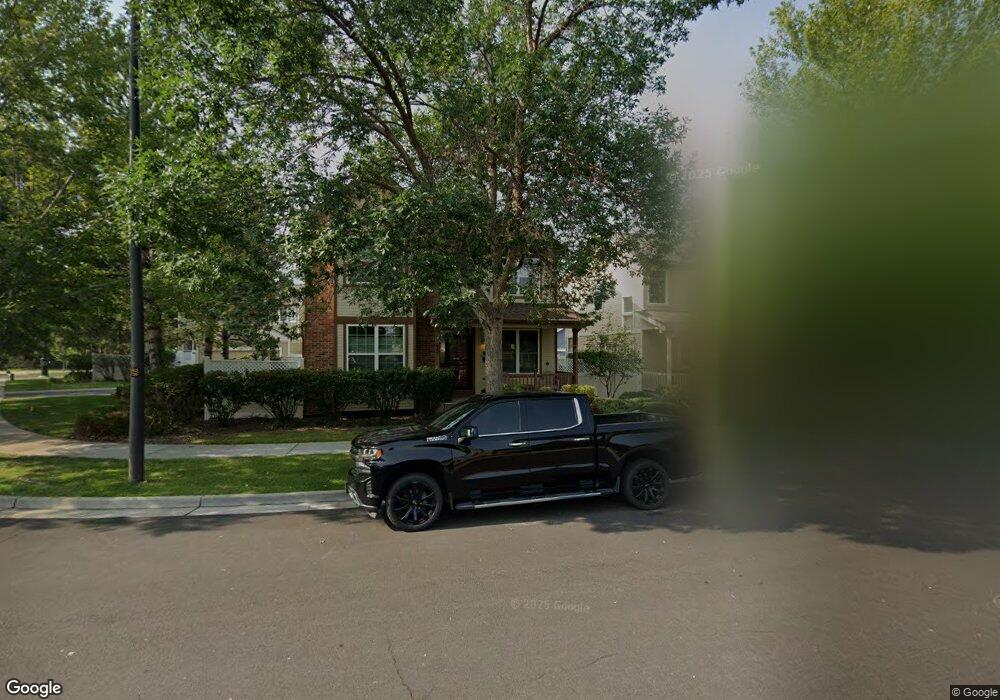
85 S Ulster St Denver, CO 80230
Lowry NeighborhoodEstimated Value: $812,000 - $938,000
3
Beds
3
Baths
2,131
Sq Ft
$401/Sq Ft
Est. Value
About This Home
This home is located at 85 S Ulster St, Denver, CO 80230 and is currently estimated at $854,803, approximately $401 per square foot. 85 S Ulster St is a home located in Denver County with nearby schools including Lowry Elementary School, Hill Campus of Arts & Sciences, and George Washington High School.
Ownership History
Date
Name
Owned For
Owner Type
Purchase Details
Closed on
Oct 10, 2003
Sold by
Jarosh Robert C and Jarosh Cathy L
Bought by
Ampe Peter J and Livingston Lisa A
Current Estimated Value
Home Financials for this Owner
Home Financials are based on the most recent Mortgage that was taken out on this home.
Original Mortgage
$295,900
Outstanding Balance
$135,712
Interest Rate
5.96%
Mortgage Type
Purchase Money Mortgage
Estimated Equity
$719,091
Purchase Details
Closed on
Sep 6, 2002
Sold by
Prudential Residential Svcs Ltd Prtnrshp
Bought by
Jarosh Robert C and Jarosh Cathy L
Home Financials for this Owner
Home Financials are based on the most recent Mortgage that was taken out on this home.
Original Mortgage
$288,000
Interest Rate
6.25%
Mortgage Type
Balloon
Purchase Details
Closed on
Sep 8, 1999
Sold by
Village Homes Of Colorado Inc
Bought by
Howard David R and Howard Dawn M
Home Financials for this Owner
Home Financials are based on the most recent Mortgage that was taken out on this home.
Original Mortgage
$225,000
Interest Rate
7%
Create a Home Valuation Report for This Property
The Home Valuation Report is an in-depth analysis detailing your home's value as well as a comparison with similar homes in the area
Home Values in the Area
Average Home Value in this Area
Purchase History
| Date | Buyer | Sale Price | Title Company |
|---|---|---|---|
| Ampe Peter J | $369,900 | -- | |
| Jarosh Robert C | $360,000 | Chicago Title Co | |
| Howard David R | $251,897 | Land Title |
Source: Public Records
Mortgage History
| Date | Status | Borrower | Loan Amount |
|---|---|---|---|
| Open | Ampe Peter J | $295,900 | |
| Previous Owner | Jarosh Robert C | $288,000 | |
| Previous Owner | Howard David R | $225,000 | |
| Closed | Jarosh Robert C | $54,000 |
Source: Public Records
Tax History Compared to Growth
Tax History
| Year | Tax Paid | Tax Assessment Tax Assessment Total Assessment is a certain percentage of the fair market value that is determined by local assessors to be the total taxable value of land and additions on the property. | Land | Improvement |
|---|---|---|---|---|
| 2024 | $3,985 | $50,310 | $5,940 | $44,370 |
| 2023 | $3,898 | $50,310 | $5,940 | $44,370 |
| 2022 | $3,492 | $43,910 | $7,770 | $36,140 |
| 2021 | $3,371 | $45,170 | $7,990 | $37,180 |
| 2020 | $3,127 | $42,140 | $7,990 | $34,150 |
| 2019 | $3,039 | $42,140 | $7,990 | $34,150 |
| 2018 | $2,836 | $36,660 | $6,900 | $29,760 |
| 2017 | $2,828 | $36,660 | $6,900 | $29,760 |
| 2016 | $2,757 | $33,810 | $7,626 | $26,184 |
| 2015 | $2,641 | $33,810 | $7,626 | $26,184 |
| 2014 | $2,530 | $30,460 | $4,649 | $25,811 |
Source: Public Records
Map
Nearby Homes
- 7883 E Bayaud Ave
- 8053 E Maple Ave
- 7702 E Maple Place Unit 7702
- 8225 E Fairmount Dr Unit 204
- 41 Quince St
- 8185 E Lowry Blvd Unit 302
- 8225 Fairmount Dr Unit 101
- 8225 Fairmount Dr Unit 102-3
- 8225 Fairmount Dr Unit 104
- 85 Uinta Way Unit 603
- 85 Uinta Way Unit 702
- 209 Quebec St Unit L
- 159 Quebec St Unit D
- 160 Poplar St Unit A
- 217 Spruce St Unit 101
- 222 S Olive St
- 6959 E Lowry Blvd
- 8300 Fairmount Dr Unit E104
- 8300 Fairmount Dr Unit P102
- 8300 Fairmount Dr Unit 104
- 75 S Ulster St
- 8051 E Bayaud Ave
- 8031 E Bayaud Ave
- 8071 E Bayaud Ave
- 65 S Ulster St
- 8011 E Bayaud Ave
- 14 S Ulster St
- 70 S Ulster St
- 80 S Ulster St
- 12 S Tamarac St
- 48 S Ulster St
- 75 S Tamarac St
- 85 S Tamarac St
- 68 S Ulster St
- 95 S Tamarac St
- 10 S Tamarac St
- 65 S Tamarac St
- 8105 E Bayaud Ave
- 46 S Ulster St
- 55 S Tamarac St