Estimated Value: $189,971 - $272,000
--
Bed
--
Bath
1,104
Sq Ft
$197/Sq Ft
Est. Value
About This Home
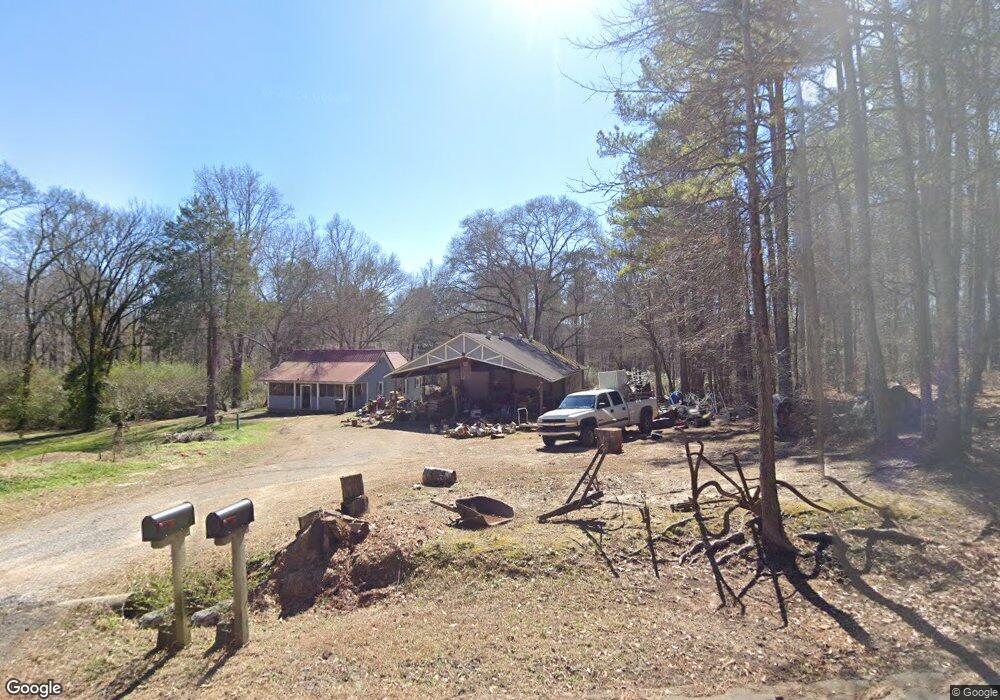
This home is located at 85 Sam Harris Rd NE, Rome, GA 30161 and is currently estimated at $217,243, approximately $196 per square foot. 85 Sam Harris Rd NE is a home located in Floyd County with nearby schools including Model Middle School and Model High School.
Ownership History
Date
Name
Owned For
Owner Type
Purchase Details
Closed on
Mar 21, 2014
Sold by
Aycock William Gordon
Bought by
Aycock Jeffery Todd
Current Estimated Value
Purchase Details
Closed on
Mar 14, 2014
Sold by
Aycock William Gordon
Bought by
Aycock William Gordon and Aycock Jeffery Todd
Purchase Details
Closed on
Sep 11, 1987
Sold by
Brewer Dolores A
Bought by
Aycock William Gordon
Purchase Details
Closed on
Jul 6, 1981
Sold by
Hammond Jeffery L
Bought by
Brewer Dolores A
Purchase Details
Closed on
Jun 1, 1981
Bought by
P and R
Purchase Details
Closed on
Jun 1, 1976
Bought by
P and R
Purchase Details
Closed on
May 29, 1976
Bought by
P and R
Purchase Details
Closed on
May 28, 1976
Sold by
Wooten Dartie R C and Fannie Bell
Bought by
Hammond Jeffery L
Purchase Details
Closed on
Jul 14, 1965
Sold by
Wooten Dartie R C
Bought by
Wooten Dartie R C and Fannie Bell
Purchase Details
Closed on
Jan 1, 1956
Bought by
Wooten Dartie R C
Create a Home Valuation Report for This Property
The Home Valuation Report is an in-depth analysis detailing your home's value as well as a comparison with similar homes in the area
Home Values in the Area
Average Home Value in this Area
Purchase History
| Date | Buyer | Sale Price | Title Company |
|---|---|---|---|
| Aycock Jeffery Todd | -- | -- | |
| Aycock William Gordon | -- | -- | |
| Aycock William Gordon | $34,300 | -- | |
| Brewer Dolores A | $31,600 | -- | |
| P | -- | -- | |
| P | -- | -- | |
| P | -- | -- | |
| P | -- | -- | |
| Hammond Jeffery L | $24,900 | -- | |
| Wooten Dartie R C | -- | -- | |
| Wooten Dartie R C | -- | -- |
Source: Public Records
Tax History Compared to Growth
Tax History
| Year | Tax Paid | Tax Assessment Tax Assessment Total Assessment is a certain percentage of the fair market value that is determined by local assessors to be the total taxable value of land and additions on the property. | Land | Improvement |
|---|---|---|---|---|
| 2024 | $1,716 | $62,872 | $12,012 | $50,860 |
| 2023 | $1,707 | $54,113 | $10,920 | $43,193 |
| 2022 | $1,298 | $43,733 | $8,663 | $35,070 |
| 2021 | $1,035 | $34,294 | $7,880 | $26,414 |
| 2020 | $912 | $29,962 | $6,852 | $23,110 |
| 2019 | $867 | $28,875 | $6,852 | $22,023 |
| 2018 | $826 | $27,442 | $6,526 | $20,916 |
| 2017 | $793 | $26,308 | $6,042 | $20,266 |
| 2016 | $787 | $25,800 | $6,040 | $19,760 |
| 2015 | $257 | $25,840 | $6,040 | $19,800 |
| 2014 | $257 | $25,840 | $6,040 | $19,800 |
Source: Public Records
Map
Nearby Homes
- 818 Morrison Camp Ground Rd NE
- 96 Collins Rd NE
- 567 Fred Kelley Rd NE
- 1644 Wayside Rd NE
- 406 Fred Kelly Rd NE
- 1849 Morrison Camp Ground Rd NE
- 0 Sunny Heights Dr NE Unit 20763412
- 0 Sunny Heights Dr NE Unit 10488106
- 11 Parkwood Dr NE
- 890 Ward Mountain Rd
- 158 Sproull Rd SE
- 0 Mcclain Rd Unit 10537234
- 145 Wiseman Rd
- 127 Branson Rd SE
- 12 Winterberry Ln SE
- 30 Mountain Creek Dr SE
- 0 Mountain Creek Dr SE Unit 10436191
- 21 Everwood Ct SE
- 84 Harris Rd NE
- 492 Moran Lake Rd NE
- 55 Sam Harris Rd NE
- 124 Sam Harris Rd NE
- 137 Sam Harris Rd NE
- 149 Sam Harris Rd NE
- 149 Sam Harris Rd NE
- 171 Sam Harris Rd NE
- 926 Morrison Camp Ground Rd NE
- 848 Morrison Camp Ground Rd NE
- 191 Sam Harris Rd NE
- 190 Sam Harris Rd NE
- 814 Morrison Camp Ground Rd NE
- 215 Sam Harris Rd NE
- 796 Morrison Camp Ground Rd NE
- 205 Sam Harris Rd NE
- 0 Sam Harris Rd NE Unit 22877419
- 0 Sam Harris Rd NE Unit 7606032
- 0 Sam Harris Rd NE Unit 3173628
- 0 Sam Harris Rd NE Unit 7218657
- 0 Sam Harris Rd NE Unit 3136859
- 0 Sam Harris Rd NE