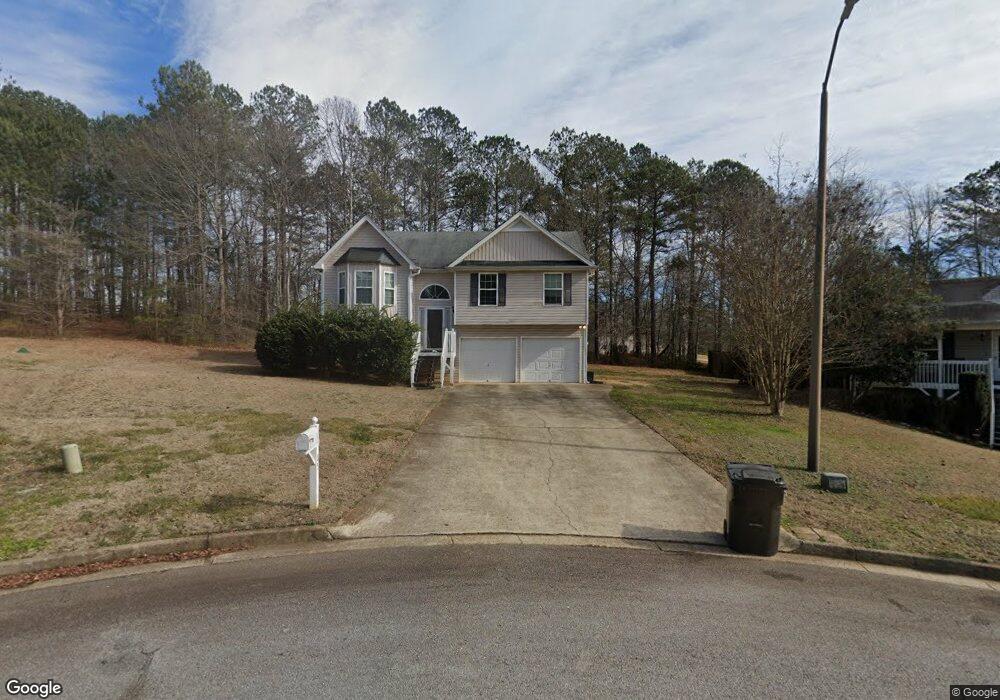
85 Shingle Oak Ct Dallas, GA 30157
Estimated Value: $248,969 - $268,000
3
Beds
2
Baths
1,172
Sq Ft
$219/Sq Ft
Est. Value
About This Home
This home is located at 85 Shingle Oak Ct, Dallas, GA 30157 and is currently estimated at $256,742, approximately $219 per square foot. 85 Shingle Oak Ct is a home located in Paulding County with nearby schools including Union Elementary School, Carl Scoggins Sr. Middle School, and South Paulding High School.
Ownership History
Date
Name
Owned For
Owner Type
Purchase Details
Closed on
Feb 23, 2011
Sold by
Federal Natl Mtg Assn Fnma
Bought by
Alexander Joe R
Current Estimated Value
Home Financials for this Owner
Home Financials are based on the most recent Mortgage that was taken out on this home.
Original Mortgage
$43,425
Outstanding Balance
$1,665
Interest Rate
4.71%
Mortgage Type
New Conventional
Estimated Equity
$255,077
Purchase Details
Closed on
Nov 2, 2010
Sold by
Wells Fargo Bk Na
Bought by
Federal Natl Mtg Assn Fnma
Purchase Details
Closed on
Apr 30, 2007
Sold by
Jaco Homes Llc
Bought by
Bailey Claude
Home Financials for this Owner
Home Financials are based on the most recent Mortgage that was taken out on this home.
Original Mortgage
$98,320
Interest Rate
6.1%
Mortgage Type
New Conventional
Create a Home Valuation Report for This Property
The Home Valuation Report is an in-depth analysis detailing your home's value as well as a comparison with similar homes in the area
Home Values in the Area
Average Home Value in this Area
Purchase History
| Date | Buyer | Sale Price | Title Company |
|---|---|---|---|
| Alexander Joe R | $109,884 | -- | |
| Federal Natl Mtg Assn Fnma | -- | -- | |
| Wells Fargo Bk Na | $109,883 | -- | |
| Bailey Claude | $122,900 | -- |
Source: Public Records
Mortgage History
| Date | Status | Borrower | Loan Amount |
|---|---|---|---|
| Open | Alexander Joe R | $43,425 | |
| Previous Owner | Bailey Claude | $98,320 |
Source: Public Records
Tax History Compared to Growth
Tax History
| Year | Tax Paid | Tax Assessment Tax Assessment Total Assessment is a certain percentage of the fair market value that is determined by local assessors to be the total taxable value of land and additions on the property. | Land | Improvement |
|---|---|---|---|---|
| 2024 | $2,588 | $104,056 | $12,000 | $92,056 |
| 2023 | $2,491 | $95,568 | $12,000 | $83,568 |
| 2022 | $2,204 | $74,192 | $12,000 | $62,192 |
| 2021 | $1,825 | $61,436 | $8,000 | $53,436 |
| 2020 | $1,662 | $55,960 | $8,000 | $47,960 |
| 2019 | $1,567 | $52,000 | $8,000 | $44,000 |
| 2018 | $1,380 | $45,800 | $8,000 | $37,800 |
| 2017 | $1,248 | $40,840 | $8,000 | $32,840 |
| 2016 | $1,243 | $41,120 | $8,000 | $33,120 |
| 2015 | $1,041 | $33,840 | $8,000 | $25,840 |
| 2014 | $870 | $27,556 | $8,000 | $19,556 |
| 2013 | -- | $22,880 | $8,000 | $14,880 |
Source: Public Records
Map
Nearby Homes
- 12 Shingle Oak Ct
- 65 Cynthia Ct
- 232 Cynthia Ct
- 0 Old Yorkville Rd Unit 10574003
- 370 Buchanan Cir Unit TRACT 1
- 370 Buchanan Circle Tract 1
- 2351 Old Yorkville Rd
- 177 Rustin Dr
- 149 Peyton Ln
- 0 Rustin Dr Unit 10617842
- 0 Rustin Dr Unit 7657021
- 128 Tanner Dr
- 877 Georgia 101
- 879 Georgia 101
- 363 Safe Harbor Dr
- 65 Harmony Woods Ln
- 281 Harmony Woods Dr
- 270 Harmony Woods Dr
- 216 Lake Tanisha Dr
- 453 Mulberry Rock Rd
- 93 Shingle Oak Ct
- 79 Shingle Oak Ct
- 167 Shingle Oak Dr
- 167 Shingle Oak Dr Unit 167
- 167 Shingle Oak Dr
- 90 Shingle Oak Ct
- 84 Shingle Oak Ct
- 159 Swafford Dr
- 177 Swafford Dr
- 143 Swafford Dr
- 51 Shingle Oak Ct
- 56 Shingle Oak Ct
- 0 Shingle Oak Ct
- 161 Shingle Oak Dr
- 195 Swafford Dr
- 121 Swafford Dr
- 101 Swafford Dr
- 166 Swafford Dr
- 40 Shingle Oak Ct
- 136 Shingle Oak Dr