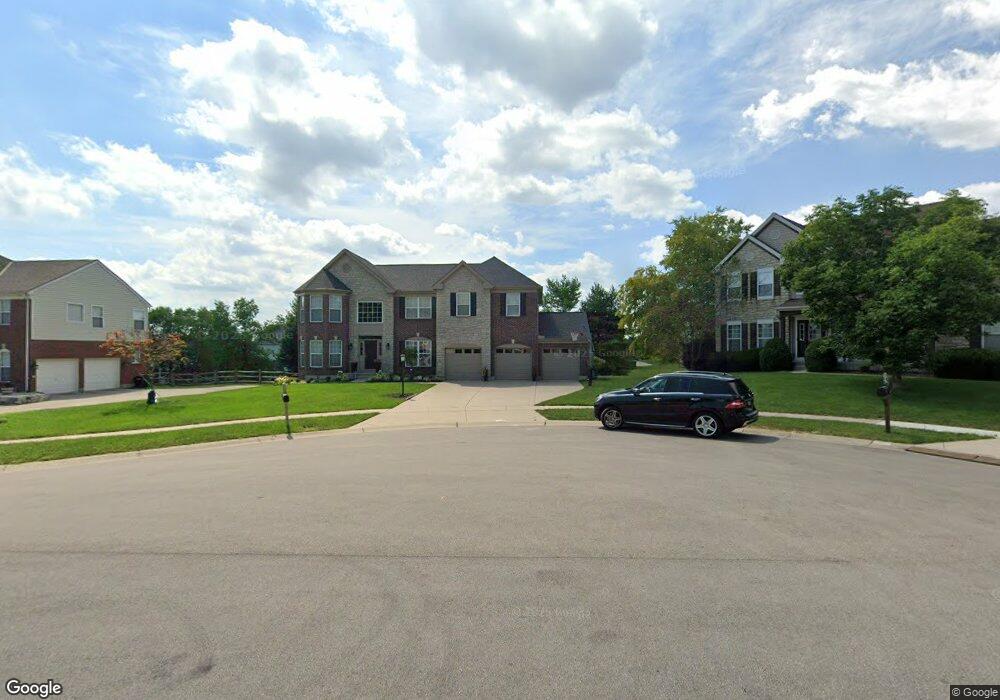
85 Stableton Way Springboro, OH 45066
Estimated Value: $453,000 - $548,000
4
Beds
2
Baths
2,604
Sq Ft
$186/Sq Ft
Est. Value
About This Home
This home is located at 85 Stableton Way, Springboro, OH 45066 and is currently estimated at $485,091, approximately $186 per square foot. 85 Stableton Way is a home located in Warren County with nearby schools including Clearcreek Elementary School, Springboro Intermediate School, and Dennis Elementary School.
Ownership History
Date
Name
Owned For
Owner Type
Purchase Details
Closed on
Dec 21, 2015
Sold by
Dearth Ross T and Dearth Elizabeth
Bought by
Wall Christopher M and Wall Amanda M
Current Estimated Value
Purchase Details
Closed on
Sep 15, 2011
Sold by
Hargrove Wanda
Bought by
Dearth Ross T and Dearth Elizabeth K
Home Financials for this Owner
Home Financials are based on the most recent Mortgage that was taken out on this home.
Original Mortgage
$213,740
Outstanding Balance
$136,310
Interest Rate
2.87%
Mortgage Type
FHA
Estimated Equity
$348,781
Purchase Details
Closed on
Feb 8, 2005
Sold by
The Drees Co
Bought by
Hargrove David L and Hargrove Wanda
Home Financials for this Owner
Home Financials are based on the most recent Mortgage that was taken out on this home.
Original Mortgage
$201,000
Interest Rate
5.8%
Mortgage Type
Purchase Money Mortgage
Purchase Details
Closed on
Jul 27, 2001
Sold by
Rhein Interests Inc
Bought by
Drees Co
Create a Home Valuation Report for This Property
The Home Valuation Report is an in-depth analysis detailing your home's value as well as a comparison with similar homes in the area
Home Values in the Area
Average Home Value in this Area
Purchase History
| Date | Buyer | Sale Price | Title Company |
|---|---|---|---|
| Wall Christopher M | -- | None Available | |
| Dearth Ross T | $219,300 | Rels Title | |
| Hargrove David L | $301,000 | Partners Land Title | |
| Drees Co | $200,000 | -- |
Source: Public Records
Mortgage History
| Date | Status | Borrower | Loan Amount |
|---|---|---|---|
| Open | Dearth Ross T | $213,740 | |
| Previous Owner | Hargrove David L | $201,000 |
Source: Public Records
Tax History Compared to Growth
Tax History
| Year | Tax Paid | Tax Assessment Tax Assessment Total Assessment is a certain percentage of the fair market value that is determined by local assessors to be the total taxable value of land and additions on the property. | Land | Improvement |
|---|---|---|---|---|
| 2024 | $5,590 | $143,150 | $38,500 | $104,650 |
| 2023 | $4,858 | $114,075 | $21,525 | $92,550 |
| 2022 | $4,786 | $114,076 | $21,525 | $92,551 |
| 2021 | $4,454 | $114,076 | $21,525 | $92,551 |
| 2020 | $4,142 | $92,743 | $17,500 | $75,243 |
| 2019 | $3,819 | $92,743 | $17,500 | $75,243 |
| 2018 | $3,822 | $92,743 | $17,500 | $75,243 |
| 2017 | $3,769 | $82,394 | $14,231 | $68,163 |
| 2016 | $3,931 | $82,394 | $14,231 | $68,163 |
| 2015 | $3,471 | $82,394 | $14,231 | $68,163 |
| 2014 | $3,565 | $80,000 | $13,820 | $66,180 |
| 2013 | $3,561 | $101,310 | $17,500 | $83,810 |
Source: Public Records
Map
Nearby Homes
- 1045 Ohio 73
- 130 Magnolia Ln
- 85 Chestnut St
- 45 Chestnut St
- 55 Chestnut St
- 25 Chestnut St
- Rockford Plan at Clearview Crossing
- Sanibel Plan at Clearview Crossing
- Birmingham Plan at Clearview Crossing
- Avalon Plan at Clearview Crossing
- Somerset Plan at Clearview Crossing
- The Longwood Plan at Clearview Crossing
- Dallas Plan at Clearview Crossing
- Carlisle Plan at Clearview Crossing
- 165 Magnolia Ln
- 80 N Lakeshore Dr
- 135 Magnolia Ln
- 65 W Waterbury Dr
- 175 S Lakeshore Dr
- 261 Myrtle Ln
- 75 Stableton Way
- 166 Farmridge Rd
- 95 Stableton Way
- 158 Farmridge Rd
- 182 Farmridge Rd
- 65 Stableton Way
- 92 Stableton Way
- 152 Farmridge Rd
- 76 Stableton Way
- 190 Farmridge Rd
- 84 Stableton Way
- 68 Stableton Way
- 55 Stableton Way
- 146 Farmridge Rd
- 167 Farmridge Rd
- 175 Farmridge Rd
- 159 Farmridge Rd
- 60 Stableton Way
- 185 Farmridge Rd
- 151 Farmridge Rd