Estimated Value: $197,502 - $258,000
2
Beds
1
Bath
701
Sq Ft
$325/Sq Ft
Est. Value
About This Home
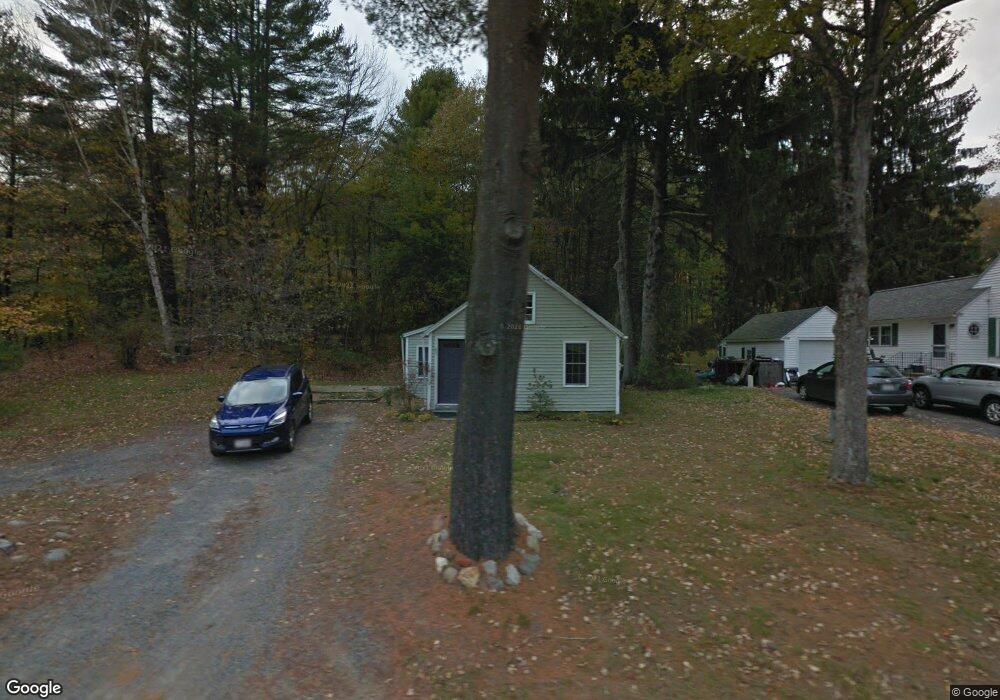
This home is located at 85 Valley Rd, Barre, MA 01005 and is currently estimated at $227,876, approximately $325 per square foot. 85 Valley Rd is a home located in Worcester County with nearby schools including Quabbin Regional Middle School and Quabbin Regional High School.
Ownership History
Date
Name
Owned For
Owner Type
Purchase Details
Closed on
Jun 13, 2002
Sold by
Franciose Lynne A
Bought by
Albro Kim L
Current Estimated Value
Home Financials for this Owner
Home Financials are based on the most recent Mortgage that was taken out on this home.
Original Mortgage
$87,300
Outstanding Balance
$36,886
Interest Rate
6.8%
Mortgage Type
Purchase Money Mortgage
Estimated Equity
$190,990
Create a Home Valuation Report for This Property
The Home Valuation Report is an in-depth analysis detailing your home's value as well as a comparison with similar homes in the area
Home Values in the Area
Average Home Value in this Area
Purchase History
| Date | Buyer | Sale Price | Title Company |
|---|---|---|---|
| Albro Kim L | $90,000 | -- | |
| Albro Kim L | $90,000 | -- |
Source: Public Records
Mortgage History
| Date | Status | Borrower | Loan Amount |
|---|---|---|---|
| Open | Albro Kim L | $27,000 | |
| Open | Albro Kim L | $87,300 | |
| Closed | Albro Kim L | $87,300 | |
| Previous Owner | Albro Kim L | $1,820 |
Source: Public Records
Tax History
| Year | Tax Paid | Tax Assessment Tax Assessment Total Assessment is a certain percentage of the fair market value that is determined by local assessors to be the total taxable value of land and additions on the property. | Land | Improvement |
|---|---|---|---|---|
| 2025 | $2,399 | $176,500 | $37,100 | $139,400 |
| 2024 | $2,350 | $168,100 | $35,300 | $132,800 |
| 2023 | $2,295 | $144,700 | $27,500 | $117,200 |
| 2022 | $2,046 | $121,500 | $23,500 | $98,000 |
| 2021 | $1,847 | $102,600 | $23,500 | $79,100 |
| 2020 | $1,782 | $99,700 | $23,500 | $76,200 |
| 2019 | $1,772 | $97,800 | $21,400 | $76,400 |
| 2018 | $1,763 | $93,800 | $21,400 | $72,400 |
| 2017 | $1,696 | $90,700 | $21,400 | $69,300 |
| 2016 | $1,565 | $87,900 | $19,400 | $68,500 |
| 2015 | $1,683 | $90,300 | $27,200 | $63,100 |
| 2014 | $1,489 | $92,700 | $33,600 | $59,100 |
Source: Public Records
Map
Nearby Homes
- 5 Old Coldbrook Rd
- 256 Worcester Rd
- 190 Summer St
- 474 Valley Rd
- 0 Agnese Ct Unit 73478399
- 50 Grove St N
- 15 Primrose Rd
- 130-132 School St
- 31 Union St
- 198 School St N
- 277 West St
- 160 Bentley Rd
- 1215 South St
- 6 Elm St S
- 865 S Barre Rd
- 23 Trafalgar Square Unit 23
- 29 High St N
- 106 Peach St
- 14 Jackson Ln
- 40 Jackson Ln
- 93 Valley Rd
- 80 Valley Rd
- 70 Valley Rd
- 88 Valley Rd
- 88 Valley Rd
- 99 Valley Rd
- 60 Valley Rd
- 102 Valley Rd
- 105 Valley Rd
- 50 Valley Rd
- 471 Summer St
- 38 Valley Rd
- 118 Valley Rd
- 531 Summer St Unit 1
- 531 Summer St
- 531 Summer St Unit 2
- 531 Summer St Unit Window
- Lot 2 Summer St
- 590 Summer St Unit 2
- 590 Summer St
Your Personal Tour Guide
Ask me questions while you tour the home.