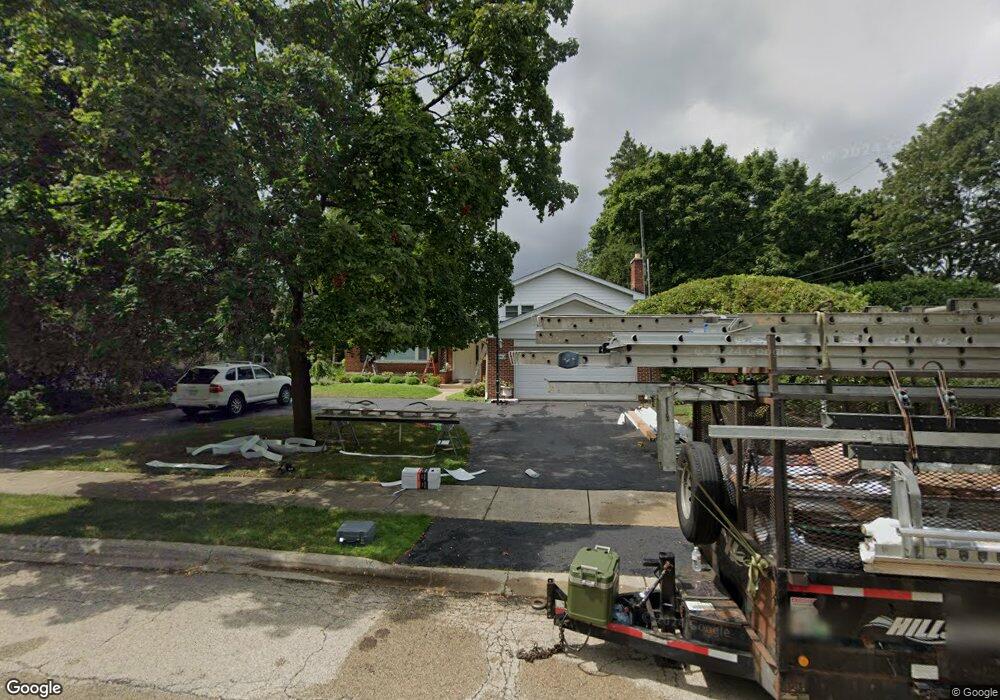
850 Appletree Ct Northbrook, IL 60062
Estimated Value: $612,720 - $883,000
4
Beds
4
Baths
1,530
Sq Ft
$474/Sq Ft
Est. Value
About This Home
This home is located at 850 Appletree Ct, Northbrook, IL 60062 and is currently estimated at $724,930, approximately $473 per square foot. 850 Appletree Ct is a home located in Cook County with nearby schools including Westmoor Elementary School, Northbrook Junior High School, and Glenbrook North High School.
Ownership History
Date
Name
Owned For
Owner Type
Purchase Details
Closed on
Dec 18, 2025
Sold by
Cevallos-Candau Pedro J and Brockman Pamela A
Bought by
Pamela A Brockman Living Trust and Brockman
Current Estimated Value
Purchase Details
Closed on
Jan 9, 2013
Sold by
Cevallos Candau Pedro J and Cevallos Pedro J
Bought by
Cevallos Candau Pedro J and Brockman Pamela A
Purchase Details
Closed on
Jul 11, 1998
Sold by
Resnick Adele M
Bought by
Cevallos Pedro J and Brockman Pamela A
Home Financials for this Owner
Home Financials are based on the most recent Mortgage that was taken out on this home.
Original Mortgage
$266,400
Interest Rate
7.25%
Create a Home Valuation Report for This Property
The Home Valuation Report is an in-depth analysis detailing your home's value as well as a comparison with similar homes in the area
Home Values in the Area
Average Home Value in this Area
Purchase History
| Date | Buyer | Sale Price | Title Company |
|---|---|---|---|
| Pamela A Brockman Living Trust | -- | None Listed On Document | |
| Cevallos Candau Pedro J | -- | None Available | |
| Cevallos Pedro J | $333,000 | Professional National Title |
Source: Public Records
Mortgage History
| Date | Status | Borrower | Loan Amount |
|---|---|---|---|
| Previous Owner | Cevallos Pedro J | $266,400 |
Source: Public Records
Tax History
| Year | Tax Paid | Tax Assessment Tax Assessment Total Assessment is a certain percentage of the fair market value that is determined by local assessors to be the total taxable value of land and additions on the property. | Land | Improvement |
|---|---|---|---|---|
| 2025 | $12,150 | $71,000 | $18,225 | $52,775 |
| 2024 | $12,150 | $59,153 | $18,225 | $40,928 |
| 2023 | $11,743 | $59,153 | $18,225 | $40,928 |
| 2022 | $11,743 | $59,153 | $18,225 | $40,928 |
| 2021 | $7,811 | $37,261 | $15,795 | $21,466 |
| 2020 | $7,755 | $37,261 | $15,795 | $21,466 |
| 2019 | $8,022 | $43,258 | $15,795 | $27,463 |
| 2018 | $7,987 | $40,288 | $13,972 | $26,316 |
| 2017 | $7,805 | $40,288 | $13,972 | $26,316 |
| 2016 | $8,108 | $40,288 | $13,972 | $26,316 |
| 2015 | $9,366 | $42,157 | $11,542 | $30,615 |
| 2014 | $8,959 | $42,157 | $11,542 | $30,615 |
| 2013 | $8,670 | $42,157 | $11,542 | $30,615 |
Source: Public Records
Map
Nearby Homes
- 2700 Crabtree Ln
- 847 Division St
- 2506 Peachtree Ln
- 818 Bach St
- 3030 Pheasant Creek Dr Unit 405
- 3030 Pheasant Creek Dr Unit 102
- 580 Greenwood Rd
- 579 Greenwood Rd
- 701 Anthony Trail
- 2535 Stonebridge Ln
- 3070 Pheasant Creek Dr Unit 207
- 575 Helen Dr
- 3085 Pheasant Creek Dr Unit 212
- 2348 Ash Ln
- 3110 Pheasant Creek Dr Unit 101
- 3110 Pheasant Creek Dr Unit 104
- 3110 Pheasant Creek Dr Unit 318
- 925 Spring Hill Dr Unit 101
- 1331 Pfingsten Rd
- 1341 Pfingsten Rd
- 860 Appletree Ct
- 840 Appletree Ct
- 2715 Appletree Ln
- 870 Appletree Ct
- 2725 Appletree Ln
- 2775 Appletree Ln
- 2785 Appletree Ln
- 880 Appletree Ct
- 2795 Appletree Ln
- 845 Appletree Ct
- 855 Appletree Ct
- 865 Appletree Ct
- 2765 Appletree Ln
- 875 Appletree Ct
- 2800 Crabtree Ln
- 2675 Appletree Ln
- 890 Appletree Ct
- 885 Appletree Ct
- 2790 Crabtree Ln
- 2710 Appletree Ln
Your Personal Tour Guide
Ask me questions while you tour the home.