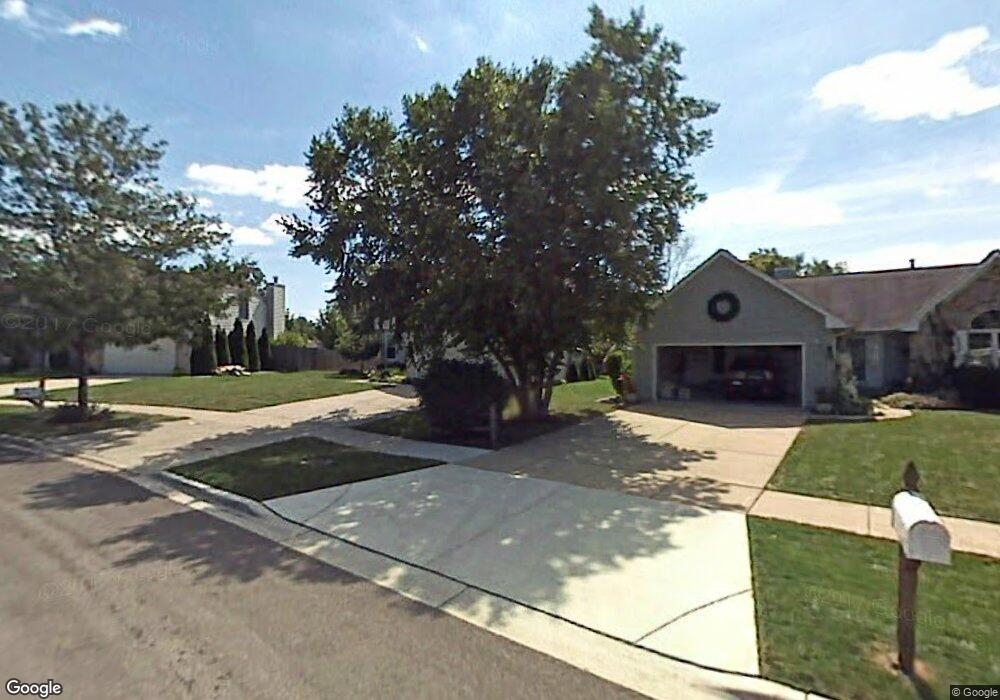
850 Hearthstone Ct Unit 2 Aurora, IL 60506
Edgelawn Randall NeighborhoodEstimated Value: $376,000 - $403,000
--
Bed
1
Bath
2,186
Sq Ft
$179/Sq Ft
Est. Value
About This Home
This home is located at 850 Hearthstone Ct Unit 2, Aurora, IL 60506 and is currently estimated at $391,621, approximately $179 per square foot. 850 Hearthstone Ct Unit 2 is a home located in Kane County with nearby schools including Hall Elementary School, Jefferson Middle School, and West Aurora High School.
Ownership History
Date
Name
Owned For
Owner Type
Purchase Details
Closed on
Sep 14, 2001
Sold by
Bastian Shelley L
Bought by
Carbajal Marisol and Carbajal Eleazar
Current Estimated Value
Home Financials for this Owner
Home Financials are based on the most recent Mortgage that was taken out on this home.
Original Mortgage
$156,000
Outstanding Balance
$60,831
Interest Rate
6.99%
Estimated Equity
$330,790
Purchase Details
Closed on
Apr 17, 2001
Sold by
Bastian Shelley I and Bastian Gregory J
Bought by
Bastian Shelley L
Purchase Details
Closed on
Nov 5, 1996
Sold by
Merchants National Bank Of Aurora
Bought by
Bastian Gregory J and Bastian Shelley L
Home Financials for this Owner
Home Financials are based on the most recent Mortgage that was taken out on this home.
Original Mortgage
$149,450
Interest Rate
7.5%
Mortgage Type
Seller Take Back
Create a Home Valuation Report for This Property
The Home Valuation Report is an in-depth analysis detailing your home's value as well as a comparison with similar homes in the area
Home Values in the Area
Average Home Value in this Area
Purchase History
| Date | Buyer | Sale Price | Title Company |
|---|---|---|---|
| Carbajal Marisol | $195,000 | First American | |
| Bastian Shelley L | -- | -- | |
| Bastian Gregory J | $187,000 | Chicago Title Insurance Co |
Source: Public Records
Mortgage History
| Date | Status | Borrower | Loan Amount |
|---|---|---|---|
| Open | Carbajal Marisol | $156,000 | |
| Previous Owner | Bastian Gregory J | $149,450 | |
| Closed | Bastian Gregory J | $28,000 | |
| Closed | Carbajal Marisol | $19,000 |
Source: Public Records
Tax History Compared to Growth
Tax History
| Year | Tax Paid | Tax Assessment Tax Assessment Total Assessment is a certain percentage of the fair market value that is determined by local assessors to be the total taxable value of land and additions on the property. | Land | Improvement |
|---|---|---|---|---|
| 2024 | $9,058 | $122,401 | $21,211 | $101,190 |
| 2023 | $8,682 | $109,365 | $18,952 | $90,413 |
| 2022 | $8,302 | $99,786 | $17,292 | $82,494 |
| 2021 | $7,975 | $93,284 | $16,099 | $77,185 |
| 2020 | $7,550 | $86,647 | $14,954 | $71,693 |
| 2019 | $7,263 | $80,280 | $13,855 | $66,425 |
| 2018 | $7,337 | $79,499 | $12,816 | $66,683 |
| 2017 | $8,205 | $85,727 | $11,809 | $73,918 |
| 2016 | $7,359 | $75,270 | $10,123 | $65,147 |
| 2015 | -- | $65,729 | $8,705 | $57,024 |
| 2014 | -- | $61,325 | $8,372 | $52,953 |
| 2013 | -- | $60,452 | $8,253 | $52,199 |
Source: Public Records
Map
Nearby Homes
- 972 Westgate Dr
- 833 N Randall Rd Unit C4
- 1389 Monomoy St Unit B2
- 1035 Newcastle Ln
- 1390 N Glen Cir Unit B
- 630 N Buell Ave
- 1351 Monomoy St Unit D
- 1747 W Illinois Ave
- 1149 Newcastle Ln
- 1296 Yellowpine Dr
- 960 Sapphire Ln
- 964 Sapphire Ln
- 967 Sapphire Ln
- 959 Sapphire Ln
- 963 Sapphire Ln
- 1120 Emerald Dr
- 1104 New Haven Ave
- 1735 Greene Ct
- 1751 Greene Ct
- 865 N Fordham Ave
- 844 Hearthstone Ct
- 856 Hearthstone Ct
- 1525 Crestwood Ct
- 1515 Crestwood Ct
- 860 Hearthstone Ct Unit 1
- 905 Wellington Cir
- 1535 Crestwood Ct
- 1495 Crestwood Ct
- 909 Wellington Cir
- 849 Hearthstone Ct
- 866 Hearthstone Ct
- 901 Wellington Cir
- 1485 Crestwood Ct
- 889 Hearthstone Ct
- 1545 Crestwood Ct
- 913 Wellington Cir
- 916 Wellington Cir
- 1520 Crestwood Ct
- 1475 Crestwood Ct
- 870 Hearthstone Ct