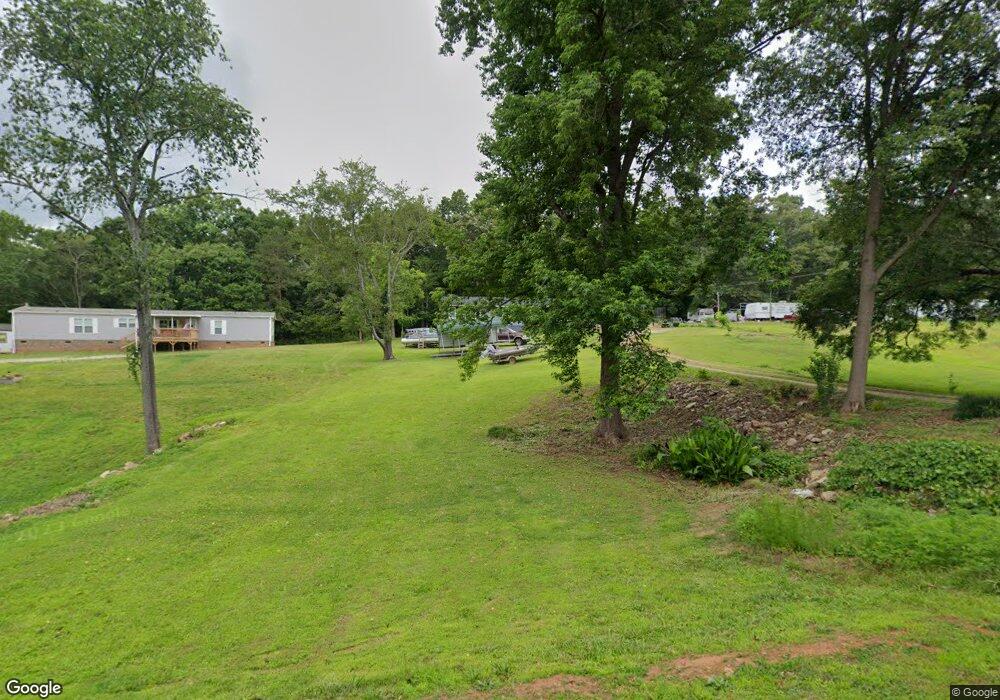
850 Hillcrest Cir Unit 2 Hartwell, GA 30643
Estimated Value: $271,218 - $412,000
4
Beds
2
Baths
1,508
Sq Ft
$228/Sq Ft
Est. Value
About This Home
This home is located at 850 Hillcrest Cir Unit 2, Hartwell, GA 30643 and is currently estimated at $344,055, approximately $228 per square foot. 850 Hillcrest Cir Unit 2 is a home located in Hart County with nearby schools including Hart County High School.
Ownership History
Date
Name
Owned For
Owner Type
Purchase Details
Closed on
May 13, 2021
Sold by
Snellings Bryon
Bought by
Worley Melvin Douglas and Worley Elizabeth Ann
Current Estimated Value
Home Financials for this Owner
Home Financials are based on the most recent Mortgage that was taken out on this home.
Original Mortgage
$138,750
Outstanding Balance
$125,546
Interest Rate
3%
Mortgage Type
New Conventional
Estimated Equity
$218,509
Purchase Details
Closed on
Jan 9, 2020
Sold by
Snellings Bryon
Bought by
Snellings Bryon and Snellings Kayla
Purchase Details
Closed on
Apr 29, 2016
Sold by
Buffington Kenneth D
Bought by
Snellings Bryon
Home Financials for this Owner
Home Financials are based on the most recent Mortgage that was taken out on this home.
Original Mortgage
$102,827
Interest Rate
3.71%
Mortgage Type
FHA
Purchase Details
Closed on
Aug 1, 1986
Purchase Details
Closed on
Dec 1, 1984
Purchase Details
Closed on
May 1, 1984
Create a Home Valuation Report for This Property
The Home Valuation Report is an in-depth analysis detailing your home's value as well as a comparison with similar homes in the area
Home Values in the Area
Average Home Value in this Area
Purchase History
| Date | Buyer | Sale Price | Title Company |
|---|---|---|---|
| Worley Melvin Douglas | $185,000 | -- | |
| Snellings Bryon | -- | -- | |
| Snellings Bryon | $100,000 | -- | |
| -- | $21,000 | -- | |
| -- | -- | -- | |
| -- | -- | -- |
Source: Public Records
Mortgage History
| Date | Status | Borrower | Loan Amount |
|---|---|---|---|
| Open | Worley Melvin Douglas | $138,750 | |
| Previous Owner | Snellings Bryon | $102,827 |
Source: Public Records
Tax History Compared to Growth
Tax History
| Year | Tax Paid | Tax Assessment Tax Assessment Total Assessment is a certain percentage of the fair market value that is determined by local assessors to be the total taxable value of land and additions on the property. | Land | Improvement |
|---|---|---|---|---|
| 2024 | $1,369 | $88,666 | $8,800 | $79,866 |
| 2023 | $1,253 | $75,258 | $8,800 | $66,458 |
| 2022 | $1,113 | $66,864 | $8,800 | $58,064 |
| 2021 | $728 | $39,222 | $8,800 | $30,422 |
| 2020 | $700 | $36,130 | $7,200 | $28,930 |
| 2019 | $630 | $32,218 | $4,800 | $27,418 |
| 2018 | $654 | $33,096 | $4,800 | $28,296 |
| 2017 | $651 | $32,736 | $4,800 | $27,936 |
| 2016 | $677 | $32,998 | $4,800 | $28,198 |
| 2015 | $649 | $33,330 | $5,400 | $27,930 |
| 2014 | $659 | $33,192 | $6,000 | $27,192 |
| 2013 | -- | $33,604 | $6,000 | $27,604 |
Source: Public Records
Map
Nearby Homes
- 256 Tahoe Dr
- 2569 Reed Creek Hwy
- 2375 Reed Creek Hwy
- 01 Mount Olivet Rd
- 1024 Mount Olivet Rd
- 328 Walnut Dr
- 9 Pointe Sidney Dr
- 330 Ivy Trail
- 134 Yorkshores Ln
- 1258 Old Beacon Light Rd
- 680 Fred King Rd
- 2850 Mount Hebron Rd
- 626 Vickery Street Extension
- 177 Sawyer Ln
- LOT E2 Nylah Ln
- LOT E1 Nylah Ln
- 1036 Lightwood Rd
- 1000 & 1036 Lightwood Rd
- 136 Grandview Ct
- 80 Creek Stone Dr
- 850 Hillcrest Cir
- 25 Ivory St
- 25 Ivory St Unit 10
- 51 Ivory St
- 117 Ivory St Unit 14
- 117 Ivory St
- 307 Foothills Dr
- 307 Foothill Dr
- 271 Foothills Dr
- 259 Foothills Dr
- 289 Foothills Dr
- 241 Foothills Dr
- 221 Foothills Dr
- 744 Hillcrest Cir
- 207 Foothills Dr
- 177 Foothills Dr
- 278 Foothills Dr
- 167 Foothills Dr
- 2 Westside Ln
- 33 Westside Ln