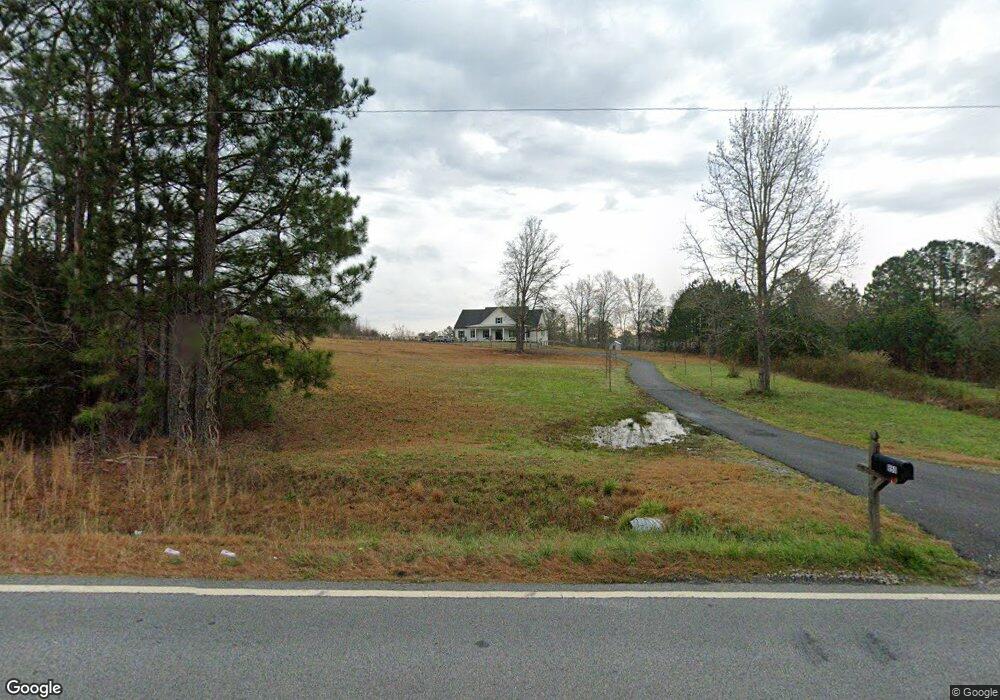
850 Kings Bridge Rd Williamson, GA 30292
Estimated Value: $581,000 - $594,000
4
Beds
4
Baths
2,791
Sq Ft
$210/Sq Ft
Est. Value
About This Home
This home is located at 850 Kings Bridge Rd, Williamson, GA 30292 and is currently estimated at $587,160, approximately $210 per square foot. 850 Kings Bridge Rd is a home with nearby schools including Pike County Primary School, Pike County Elementary School, and Pike County Middle School.
Ownership History
Date
Name
Owned For
Owner Type
Purchase Details
Closed on
Sep 30, 2016
Sold by
Jdc Homes Llc
Bought by
Majoros Evan Craig and Majoros Alison Diane
Current Estimated Value
Home Financials for this Owner
Home Financials are based on the most recent Mortgage that was taken out on this home.
Original Mortgage
$374,775
Outstanding Balance
$300,452
Interest Rate
3.46%
Mortgage Type
New Conventional
Estimated Equity
$286,708
Purchase Details
Closed on
Oct 31, 2014
Sold by
Chandler Thomas B
Bought by
Eidson Kaehla Jo
Home Financials for this Owner
Home Financials are based on the most recent Mortgage that was taken out on this home.
Original Mortgage
$57,400
Interest Rate
4.26%
Mortgage Type
New Conventional
Purchase Details
Closed on
Dec 24, 2013
Sold by
Mask Jason
Bought by
Chandler Thomas B
Purchase Details
Closed on
Jun 19, 2007
Sold by
Not Provided
Bought by
Chandler Thomas B and Mask Jason
Create a Home Valuation Report for This Property
The Home Valuation Report is an in-depth analysis detailing your home's value as well as a comparison with similar homes in the area
Home Values in the Area
Average Home Value in this Area
Purchase History
| Date | Buyer | Sale Price | Title Company |
|---|---|---|---|
| Majoros Evan Craig | -- | -- | |
| Majoros Evan Craig | $394,500 | -- | |
| Jdc Homes Llc | -- | -- | |
| Eidson Kaehla Jo | $62,400 | -- | |
| Chandler Thomas B | -- | -- | |
| Chandler Thomas B | -- | -- |
Source: Public Records
Mortgage History
| Date | Status | Borrower | Loan Amount |
|---|---|---|---|
| Open | Majoros Evan Craig | $374,775 | |
| Closed | Majoros Evan Craig | $374,775 | |
| Previous Owner | Eidson Kaehla Jo | $57,400 |
Source: Public Records
Tax History Compared to Growth
Tax History
| Year | Tax Paid | Tax Assessment Tax Assessment Total Assessment is a certain percentage of the fair market value that is determined by local assessors to be the total taxable value of land and additions on the property. | Land | Improvement |
|---|---|---|---|---|
| 2024 | $4,576 | $186,543 | $23,623 | $162,920 |
| 2023 | $5,358 | $186,543 | $23,623 | $162,920 |
| 2022 | $3,958 | $138,303 | $23,623 | $114,680 |
| 2021 | $3,823 | $129,207 | $14,527 | $114,680 |
| 2020 | $3,867 | $129,207 | $14,527 | $114,680 |
| 2019 | $3,823 | $112,627 | $14,527 | $98,100 |
| 2018 | $3,977 | $137,627 | $14,527 | $123,100 |
| 2017 | $4,717 | $137,627 | $14,527 | $123,100 |
| 2016 | $462 | $14,527 | $14,527 | $0 |
| 2015 | $440 | $14,527 | $14,527 | $0 |
| 2014 | $446 | $14,527 | $14,527 | $0 |
| 2013 | -- | $14,526 | $14,526 | $0 |
Source: Public Records
Map
Nearby Homes
- 2337 Hollonville Rd
- 5548 Georgia 362
- 2192 Gaulding Rd
- 4170 Hollonville Rd
- 223 Ward Rd
- 965 Hood Rd
- 481 Turner Rd
- 1881 Beeks Rd
- 357 Shady Creek Trail
- 120 Courtland Rd
- 4091 Hollonville Rd
- 2310 Hollonville Rd
- 719 Fairview Rd
- 0 Blackmon Rd
- 971 Traveler Ln Unit 43
- 1003 Traveler Ln Unit 44
- 851 Traveler Ln Unit 39
- 861 Traveler Ln Unit 40
- 708 Traveler Ln
- 708 Traveler Ln Unit LOT 54
- 754 Kings Bridge Rd
- 954 Kings Bridge Rd
- 389 Huff Creek Rd
- 910 Kings Bridge Rd
- 345 Huff Creek Rd
- 1074 Kings Bridge Rd
- 1024 Kings Bridge Rd
- 977 Kings Bridge Rd
- 660 Kings Bridge Rd
- 577 Kings Bridge Rd
- 1120 Kings Bridge Rd
- 535 Huff Creek Rd
- 1135 Kings Bridge Rd
- 677 Huff Creek Rd
- 1203 Kings Bridge Rd Tract B
- 1203 Kings Bridge Rd
- 1203 Kings Bridge Rd Unit TRACT B
- 575 Kings Bridge Rd
- 575 Kings Bridge Rd
- 1295 Kings Bridge Rd