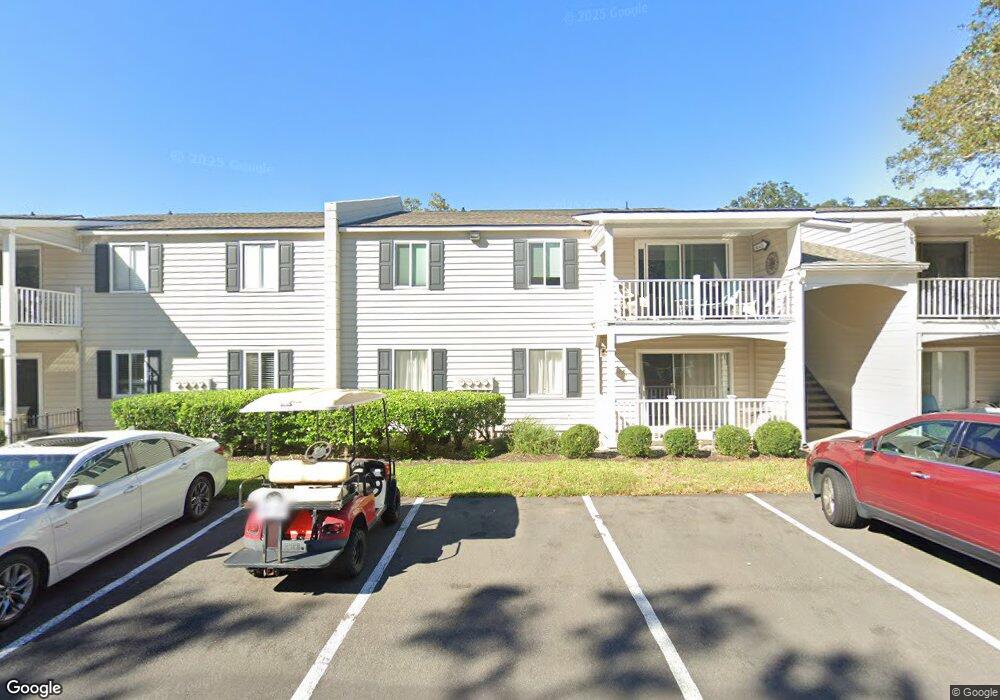
850 Mallery St Unit 9T Saint Simons Island, GA 31522
Estimated Value: $313,000 - $405,000
1
Bed
1
Bath
750
Sq Ft
$491/Sq Ft
Est. Value
About This Home
This home is located at 850 Mallery St Unit 9T, Saint Simons Island, GA 31522 and is currently estimated at $368,127, approximately $490 per square foot. 850 Mallery St Unit 9T is a home located in Glynn County with nearby schools including St. Simons Elementary School, Glynn Middle School, and Glynn Academy.
Ownership History
Date
Name
Owned For
Owner Type
Purchase Details
Closed on
Mar 1, 2024
Sold by
Behrend Kelsey M
Bought by
Allan Cathy S
Current Estimated Value
Home Financials for this Owner
Home Financials are based on the most recent Mortgage that was taken out on this home.
Original Mortgage
$311,400
Outstanding Balance
$305,917
Interest Rate
6.63%
Mortgage Type
New Conventional
Estimated Equity
$62,210
Purchase Details
Closed on
Sep 17, 2021
Sold by
Meek Brent W
Bought by
Behrend Kelsey M
Purchase Details
Closed on
Feb 26, 2019
Sold by
T & M Grant Properties Llc
Bought by
Meek Brent W and Meek Alisha Barbee
Home Financials for this Owner
Home Financials are based on the most recent Mortgage that was taken out on this home.
Original Mortgage
$139,200
Interest Rate
4.4%
Mortgage Type
New Conventional
Purchase Details
Closed on
Nov 19, 2004
Sold by
Grant Henry T
Bought by
T & M Grant Properties Llc
Create a Home Valuation Report for This Property
The Home Valuation Report is an in-depth analysis detailing your home's value as well as a comparison with similar homes in the area
Home Values in the Area
Average Home Value in this Area
Purchase History
| Date | Buyer | Sale Price | Title Company |
|---|---|---|---|
| Allan Cathy S | $354,500 | -- | |
| Behrend Kelsey M | $230,000 | -- | |
| Meek Brent W | $174,000 | -- | |
| T & M Grant Properties Llc | -- | -- |
Source: Public Records
Mortgage History
| Date | Status | Borrower | Loan Amount |
|---|---|---|---|
| Open | Allan Cathy S | $311,400 | |
| Previous Owner | Meek Brent W | $139,200 |
Source: Public Records
Tax History Compared to Growth
Tax History
| Year | Tax Paid | Tax Assessment Tax Assessment Total Assessment is a certain percentage of the fair market value that is determined by local assessors to be the total taxable value of land and additions on the property. | Land | Improvement |
|---|---|---|---|---|
| 2025 | $2,829 | $112,800 | $0 | $112,800 |
| 2024 | $2,829 | $112,800 | $0 | $112,800 |
| 2023 | $1,214 | $94,000 | $0 | $94,000 |
| 2022 | $1,630 | $81,600 | $0 | $81,600 |
| 2021 | $1,810 | $70,000 | $0 | $70,000 |
| 2020 | $1,817 | $69,600 | $0 | $69,600 |
| 2019 | $1,765 | $67,600 | $0 | $67,600 |
| 2018 | $1,765 | $67,600 | $0 | $67,600 |
| 2017 | $1,415 | $54,200 | $0 | $54,200 |
| 2016 | $1,200 | $50,000 | $0 | $50,000 |
| 2015 | $1,099 | $50,000 | $0 | $50,000 |
| 2014 | $1,099 | $45,600 | $0 | $45,600 |
Source: Public Records
Map
Nearby Homes
- 850 Mallery St Unit S 3
- 850 Mallery St Unit 8K
- 850 Mallery St Unit 9W
- 850 Mallery St Unit 6A
- 850 Mallery St Unit 4O
- 850 Mallery St Unit 4W
- 850 Mallery St Unit 3M
- 900 Mallery St
- 919 Mallery St
- 800 Mallery St Unit J-89
- 800 Mallery St Unit 90
- 800 Mallery St Unit C-30
- 800 Mallery St Unit 31
- 1000 Mallery Street Extension Unit G62
- 1000 Mallery Street Extension Unit B5
- 805 Mallery St Unit E
- 125 Tiffany Ln
- 30 Admirals Cove
- 162 Toluca Ln
- 200 Salt Air Dr Unit 152
- 850 Mallery St Unit 5
- 850 Mallery St Unit 16P
- 850 Mallery St Unit 16L
- 850 Mallery St Unit 7Q
- 850 Mallery St Unit 8T
- 850 Mallery St Unit 6P
- 850 Mallery St Unit 12 J
- 850 Mallery St Unit W16
- 850 Mallery St Unit W15
- 850 Mallery St Unit W14
- 850 Mallery St Unit W13
- 850 Mallery St Unit W12
- 850 Mallery St Unit W11
- 850 Mallery St Unit W10
- 850 Mallery St Unit W9
- 850 Mallery St Unit W8
- 850 Mallery St Unit W7
- 850 Mallery St Unit W6
- 850 Mallery St Unit W5
- 850 Mallery St Unit W4