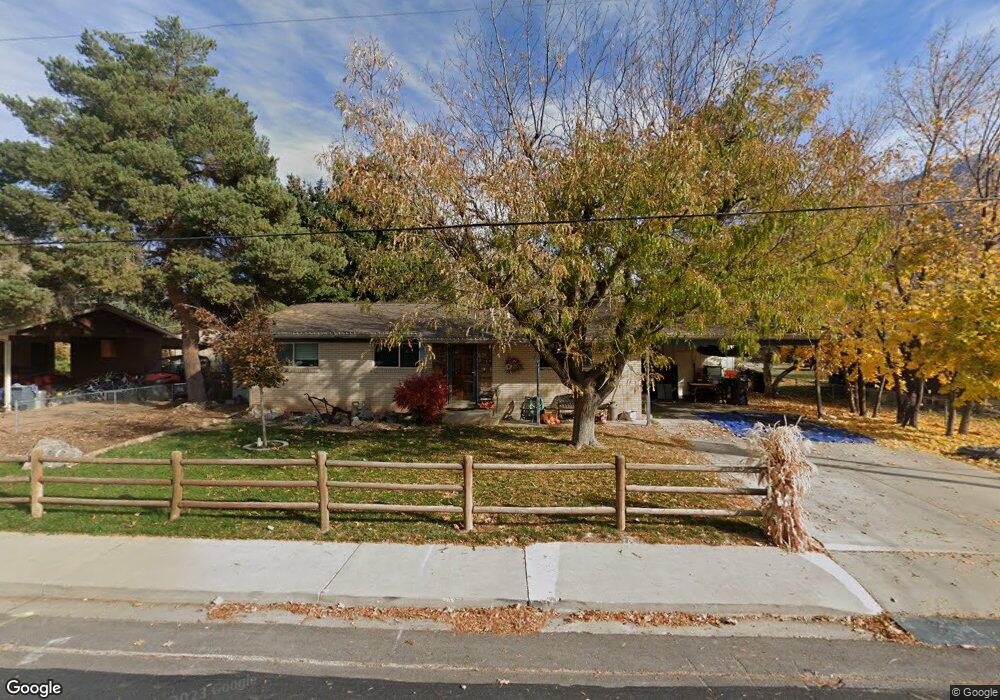
850 N 700 E Mapleton, UT 84664
Estimated Value: $615,547 - $709,000
4
Beds
3
Baths
1,444
Sq Ft
$459/Sq Ft
Est. Value
About This Home
This home is located at 850 N 700 E, Mapleton, UT 84664 and is currently estimated at $662,637, approximately $458 per square foot. 850 N 700 E is a home located in Utah County with nearby schools including Hobble Creek School, Mapleton Junior High School, and Maple Mountain High School.
Ownership History
Date
Name
Owned For
Owner Type
Purchase Details
Closed on
Feb 9, 2021
Sold by
Jensen Phillip Rex
Bought by
Jensen Phillip Rex and Jensen Markell
Current Estimated Value
Purchase Details
Closed on
Nov 14, 2019
Sold by
Jensen Patty A and The Rex And Patty Jensen Famil
Bought by
Jensen Patty A and Jensen Phillip Rex
Purchase Details
Closed on
Apr 29, 2019
Sold by
Rex And Patty Jensen Family Trust
Bought by
Jensen Patty A and Jensen Phillip Rex
Purchase Details
Closed on
Mar 6, 2013
Sold by
Jensen Rex F and Jensen Patty A
Bought by
Jensen Rex F and Jensen Patty A
Purchase Details
Closed on
Oct 28, 2005
Sold by
Evans Matthew Morgan and Nielsen Kamren R
Bought by
Nielsen Richard Page and Nielsen Vicki Stone
Create a Home Valuation Report for This Property
The Home Valuation Report is an in-depth analysis detailing your home's value as well as a comparison with similar homes in the area
Home Values in the Area
Average Home Value in this Area
Purchase History
| Date | Buyer | Sale Price | Title Company |
|---|---|---|---|
| Jensen Phillip Rex | -- | None Available | |
| Jensen Patty A | -- | None Available | |
| Jensen Patty A | -- | Richland Title Ins Agcy Inc | |
| Jensen Rex F | -- | None Available | |
| Nielsen Richard Page | -- | Access Title Company |
Source: Public Records
Tax History
| Year | Tax Paid | Tax Assessment Tax Assessment Total Assessment is a certain percentage of the fair market value that is determined by local assessors to be the total taxable value of land and additions on the property. | Land | Improvement |
|---|---|---|---|---|
| 2025 | $230 | $311,135 | -- | -- |
| 2024 | $230 | $278,740 | $0 | $0 |
| 2023 | $403 | $283,140 | $0 | $0 |
| 2022 | $552 | $318,945 | $0 | $0 |
| 2021 | $269 | $401,600 | $192,900 | $208,700 |
| 2020 | $621 | $379,400 | $170,700 | $208,700 |
| 2019 | $2,367 | $349,700 | $163,800 | $185,900 |
| 2018 | $2,097 | $294,900 | $137,900 | $157,000 |
| 2017 | $2,109 | $157,465 | $0 | $0 |
| 2016 | $1,749 | $129,800 | $0 | $0 |
| 2015 | $1,552 | $114,455 | $0 | $0 |
| 2014 | $1,448 | $104,885 | $0 | $0 |
Source: Public Records
Map
Nearby Homes
- 775 N 800 E
- 594 E 1000 N
- 435 E 1000 N
- 1096 N 1000 E
- 265 E 600 N
- 310 N 800 E
- 162 N 800 E
- 141 N 600 E
- 84 E 530 N
- 745 E Maple St
- 897 N Main St
- 1567 N 600 E Unit 26
- 1377 E Maple St
- 415 E Maple St
- 1447 N 1350 St E Unit 5
- 1577 N 1350 St E Unit 1
- 1477 N 1350 St E Unit 4
- 1547 N 1350 St E Unit 2
- 1511 N 1350 St E Unit 3
- 1548 N 1350 St E Unit 11
Your Personal Tour Guide
Ask me questions while you tour the home.