Estimated Value: $308,000 - $338,000
2
Beds
2
Baths
800
Sq Ft
$403/Sq Ft
Est. Value
About This Home
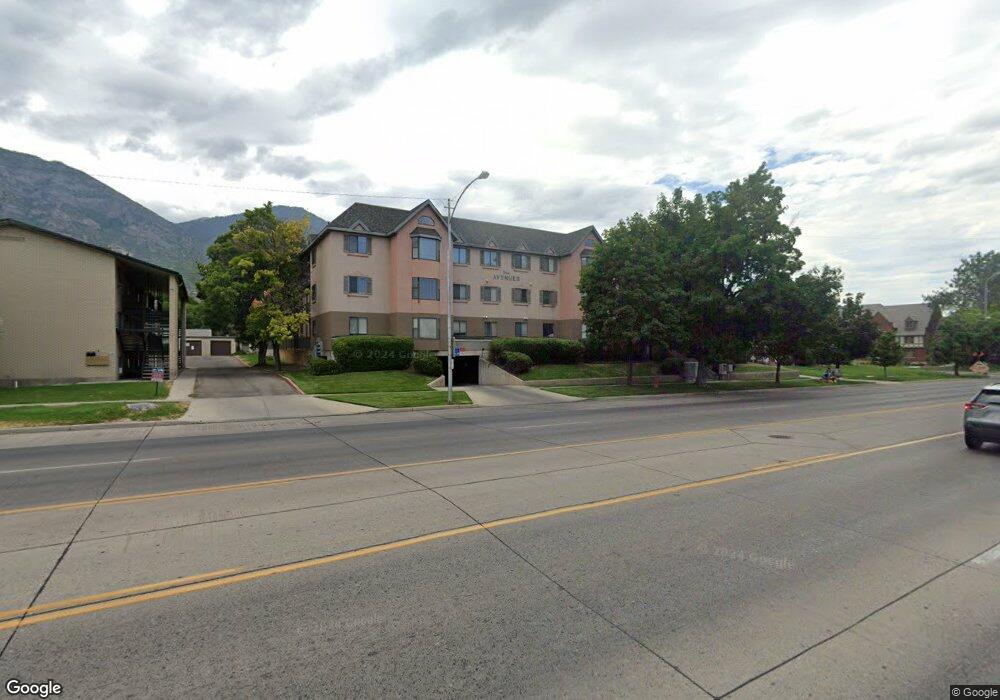
This home is located at 850 N University Ave Unit 103, Provo, UT 84604 and is currently estimated at $322,774, approximately $403 per square foot. 850 N University Ave Unit 103 is a home located in Utah County with nearby schools including Provo Peaks School, Centennial Middle School, and Timpview High School.
Ownership History
Date
Name
Owned For
Owner Type
Purchase Details
Closed on
Aug 30, 2023
Sold by
Drake Edward C and Drake Jennifer L
Bought by
Fong Alina
Current Estimated Value
Purchase Details
Closed on
Feb 10, 2017
Sold by
Kerson Edward and Kerson James
Bought by
Drake Edward C and Drake Jennifer L
Purchase Details
Closed on
Dec 16, 2009
Sold by
Kremers Linda H and Linda H Kremers 2002 Revocable
Bought by
Kerson Edward and Kerson James
Purchase Details
Closed on
Mar 25, 2004
Sold by
Johnston Jason J and Johnston Tawnie Ruth
Bought by
Brutger Wayne A and Brutger Linda H
Purchase Details
Closed on
Jun 22, 2000
Sold by
Johnston John Raymond and Johnston Lynne Johnston
Bought by
Johnston Jason J
Home Financials for this Owner
Home Financials are based on the most recent Mortgage that was taken out on this home.
Original Mortgage
$74,000
Interest Rate
8.53%
Create a Home Valuation Report for This Property
The Home Valuation Report is an in-depth analysis detailing your home's value as well as a comparison with similar homes in the area
Home Values in the Area
Average Home Value in this Area
Purchase History
| Date | Buyer | Sale Price | Title Company |
|---|---|---|---|
| Fong Alina | -- | Metro National Title | |
| Drake Edward C | -- | Old Republic Title | |
| Kerson Edward | -- | Horizon Title Insurance | |
| Brutger Wayne A | -- | Sundance Title Insurance Ag | |
| Johnston Jason J | -- | Title West Title Co |
Source: Public Records
Mortgage History
| Date | Status | Borrower | Loan Amount |
|---|---|---|---|
| Previous Owner | Johnston Jason J | $74,000 |
Source: Public Records
Tax History Compared to Growth
Tax History
| Year | Tax Paid | Tax Assessment Tax Assessment Total Assessment is a certain percentage of the fair market value that is determined by local assessors to be the total taxable value of land and additions on the property. | Land | Improvement |
|---|---|---|---|---|
| 2025 | $1,594 | $165,935 | $33,500 | $268,200 |
| 2024 | $1,594 | $156,860 | $0 | $0 |
| 2023 | $1,769 | $171,710 | $0 | $0 |
| 2022 | $1,444 | $141,295 | $0 | $0 |
| 2021 | $1,214 | $207,200 | $24,900 | $182,300 |
| 2020 | $1,197 | $191,500 | $23,000 | $168,500 |
| 2019 | $1,042 | $173,300 | $23,000 | $150,300 |
| 2018 | $1,027 | $173,300 | $32,500 | $140,800 |
| 2017 | $967 | $89,650 | $0 | $0 |
| 2016 | $1,037 | $89,650 | $0 | $0 |
| 2015 | $894 | $78,100 | $0 | $0 |
| 2014 | $846 | $77,000 | $0 | $0 |
Source: Public Records
Map
Nearby Homes
- 836 N University Ave Unit 111
- 466 N 200 E
- 136 E 400 N Unit 107
- 98 W 1230 N Unit 225
- 394 N 300 E
- 556 W 800 N Unit 18
- 250 N 100 W Unit 109
- 75 E 200 N Unit 106
- 541 E 500 N Unit 10
- 541 E 500 N Unit 12
- 361 N 300 W Unit 201
- 828 N 600 W
- 810 N 600 W
- 788 N 700 E Unit 4
- 595 N 600 W
- 611 N 700 E Unit 5
- 270 N 400 W
- 561 N 700 E
- 615 E 420 N
- 209 N 400 W
- 850 N University Ave
- 850 N University Ave
- 850 N University Ave
- 850 N University Ave Unit 230
- 850 N University Ave
- 850 N University Ave Unit 201
- 850 N University Ave Unit 200
- 850 N University Ave
- 850 N University Ave
- 850 N University Ave
- 850 N University Ave
- 850 N University Ave
- 850 N University Ave Unit 101
- 850 N University Ave Unit 100
- 850 N University Ave Unit 202
- 850 N University Ave Unit 300
- 850 N University Ave Unit 303
- 850 N University Ave Unit 301
- 850 N University Ave Unit 203
- 850 N University Ave Unit 102