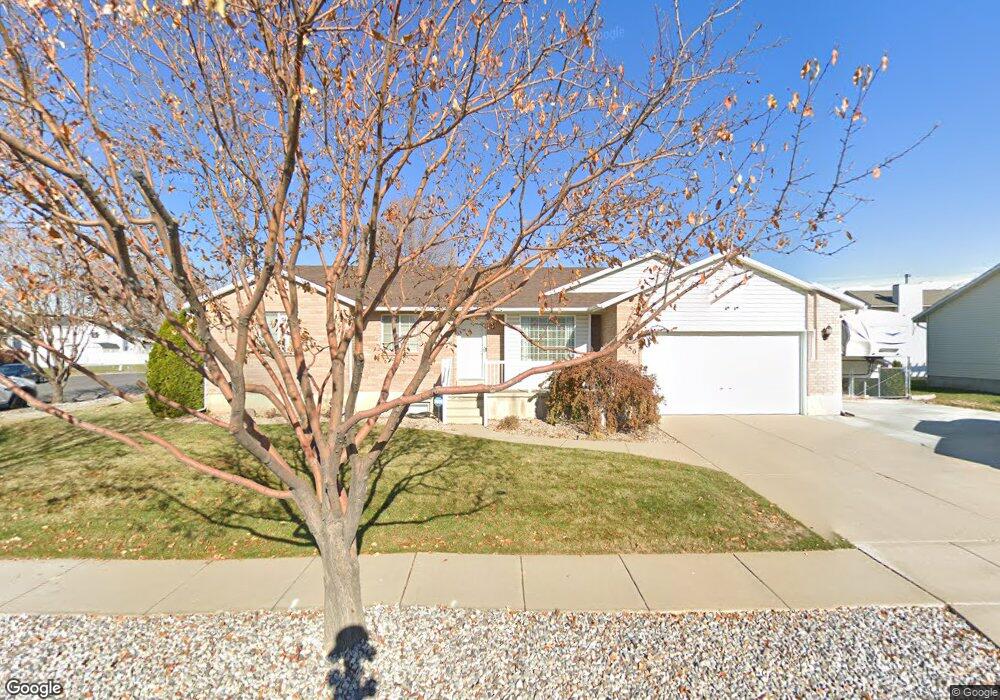
850 W 2350 N Layton, UT 84041
Estimated Value: $509,749 - $540,000
5
Beds
3
Baths
1,446
Sq Ft
$366/Sq Ft
Est. Value
About This Home
This home is located at 850 W 2350 N, Layton, UT 84041 and is currently estimated at $529,437, approximately $366 per square foot. 850 W 2350 N is a home located in Davis County with nearby schools including Lincoln Elementary School, North Layton Junior High School, and Northridge High School.
Ownership History
Date
Name
Owned For
Owner Type
Purchase Details
Closed on
Feb 25, 2014
Sold by
Nelson Lamont D and Nelson Wendy
Bought by
The Nelson Family Trust and Nelson Wendy
Current Estimated Value
Home Financials for this Owner
Home Financials are based on the most recent Mortgage that was taken out on this home.
Original Mortgage
$166,500
Interest Rate
3.41%
Mortgage Type
New Conventional
Purchase Details
Closed on
Jul 7, 2010
Sold by
Nelson Lamont D and Nelson Wendy M
Bought by
Nelson Lamont D and Nelson Wendy M
Home Financials for this Owner
Home Financials are based on the most recent Mortgage that was taken out on this home.
Original Mortgage
$168,000
Interest Rate
6.25%
Mortgage Type
New Conventional
Purchase Details
Closed on
May 10, 2006
Sold by
Nelson Lamont D and Nelson Wendy M
Bought by
Nelson Lamont D and Nelson Wendy M
Purchase Details
Closed on
Apr 4, 1996
Sold by
Nelson Lamont D
Bought by
Nelson Lamont D and Nelson Wendy M
Create a Home Valuation Report for This Property
The Home Valuation Report is an in-depth analysis detailing your home's value as well as a comparison with similar homes in the area
Home Values in the Area
Average Home Value in this Area
Purchase History
| Date | Buyer | Sale Price | Title Company |
|---|---|---|---|
| The Nelson Family Trust | -- | Backman Title Servic | |
| Nelson Lamont D | -- | Backman Title Servic | |
| Nelson Lamont D | -- | Hickman Land Title Co | |
| Nelson Lamont D | -- | Hickman Land Title Co | |
| Nelson Lamont D | -- | None Available | |
| Nelson Lamont D | -- | Security Title Company |
Source: Public Records
Mortgage History
| Date | Status | Borrower | Loan Amount |
|---|---|---|---|
| Closed | Nelson Lamont D | $166,500 | |
| Closed | Nelson Lamont D | $168,000 |
Source: Public Records
Tax History Compared to Growth
Tax History
| Year | Tax Paid | Tax Assessment Tax Assessment Total Assessment is a certain percentage of the fair market value that is determined by local assessors to be the total taxable value of land and additions on the property. | Land | Improvement |
|---|---|---|---|---|
| 2024 | $2,445 | $258,500 | $116,091 | $142,409 |
| 2023 | $2,452 | $457,000 | $136,406 | $320,594 |
| 2022 | $2,565 | $259,600 | $72,599 | $187,001 |
| 2021 | $2,385 | $360,000 | $103,115 | $256,885 |
| 2020 | $2,175 | $315,000 | $86,224 | $228,776 |
| 2019 | $2,115 | $300,000 | $81,405 | $218,595 |
| 2018 | $1,917 | $273,000 | $81,405 | $191,595 |
| 2016 | $1,816 | $133,375 | $26,356 | $107,019 |
| 2015 | $1,721 | $120,010 | $26,356 | $93,654 |
| 2014 | $1,708 | $121,802 | $26,356 | $95,446 |
| 2013 | -- | $117,260 | $26,884 | $90,376 |
Source: Public Records
Map
Nearby Homes
- 2402 N 725 W
- 2378 N 675 W
- 781 W 2150 N
- 2211 N 525 W
- 2187 N 450 W
- 2875 N Hill Field Rd Unit 58
- 2875 N Hill Field Rd Unit 17
- 2875 N Hill Field Rd Unit 62
- 709 W Highway 193
- 2887 N 1175 W
- 65 Sunset Dr
- 2949 N 1175 W
- 63 Sunset Dr
- 2600 N Hill Field Rd Unit 4
- 2600 N Hill Field Rd Unit 138
- 1837 N 440 W
- 121 Barrington Way
- 14 Lakeview Dr
- 86 Atherton Way
- 2500 N Fort Ln Unit 238