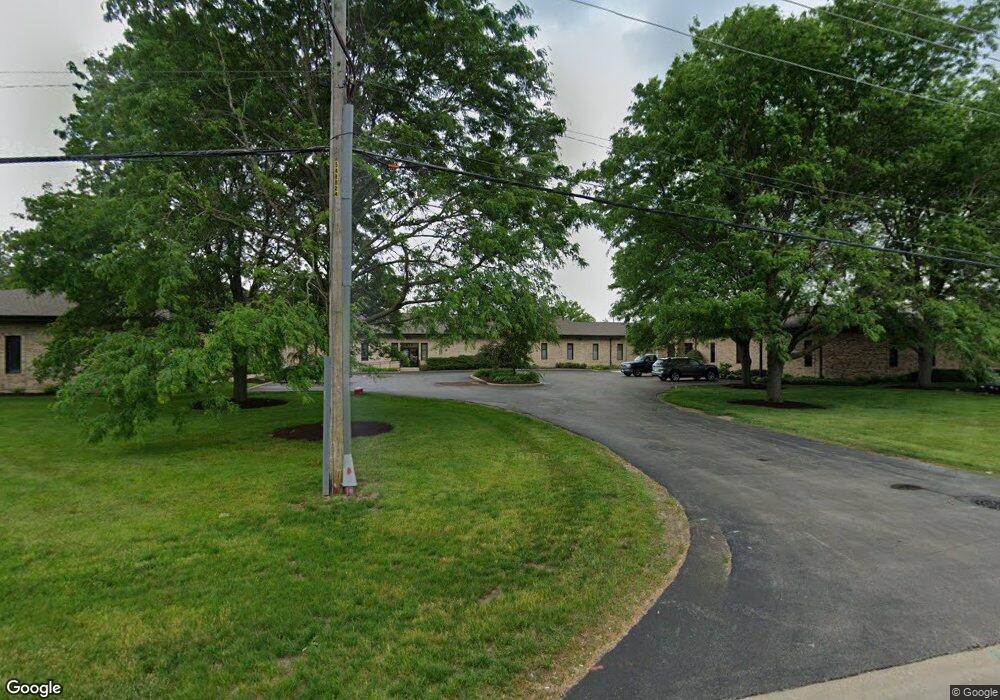
850 W Bartlett Rd Unit 1C Bartlett, IL 60103
Studio
--
Bath
--
Sq Ft
111,078
Sq Ft Lot
About This Home
This home is located at 850 W Bartlett Rd Unit 1C, Bartlett, IL 60103. 850 W Bartlett Rd Unit 1C is a home located in Cook County with nearby schools including Bartlett Elementary School, Eastview Middle School, and South Elgin High School.
Ownership History
Date
Name
Owned For
Owner Type
Purchase Details
Closed on
Dec 15, 2004
Sold by
Burch Development Corp
Bought by
Masulis Robert and Masulis Suzanne
Home Financials for this Owner
Home Financials are based on the most recent Mortgage that was taken out on this home.
Original Mortgage
$384,875
Outstanding Balance
$190,040
Interest Rate
5.83%
Mortgage Type
Commercial
Purchase Details
Closed on
Oct 29, 2004
Sold by
Masulis Robert and Burress James J
Bought by
Burch Development Corp
Home Financials for this Owner
Home Financials are based on the most recent Mortgage that was taken out on this home.
Original Mortgage
$384,875
Outstanding Balance
$190,040
Interest Rate
5.83%
Mortgage Type
Commercial
Purchase Details
Closed on
Mar 31, 2004
Sold by
Sentia Corp
Bought by
Masulis Robert and Burress James
Home Financials for this Owner
Home Financials are based on the most recent Mortgage that was taken out on this home.
Original Mortgage
$500,000
Interest Rate
5.63%
Mortgage Type
Purchase Money Mortgage
Purchase Details
Closed on
Apr 22, 2003
Sold by
Carts Judith A Giolitto and Giolitto John G
Bought by
Sentia Corp
Create a Home Valuation Report for This Property
The Home Valuation Report is an in-depth analysis detailing your home's value as well as a comparison with similar homes in the area
Home Values in the Area
Average Home Value in this Area
Purchase History
| Date | Buyer | Sale Price | Title Company |
|---|---|---|---|
| Masulis Robert | $675,000 | Atgf Inc | |
| Burch Development Corp | -- | -- | |
| Masulis Robert | $1,100,000 | Cti | |
| Sentia Corp | $725,000 | Multiple |
Source: Public Records
Mortgage History
| Date | Status | Borrower | Loan Amount |
|---|---|---|---|
| Open | Masulis Robert | $384,875 | |
| Previous Owner | Masulis Robert | $500,000 |
Source: Public Records
Tax History
| Year | Tax Paid | Tax Assessment Tax Assessment Total Assessment is a certain percentage of the fair market value that is determined by local assessors to be the total taxable value of land and additions on the property. | Land | Improvement |
|---|---|---|---|---|
| 2025 | $36,856 | $171,500 | $74,990 | $96,510 |
| 2024 | $36,856 | $116,438 | $85,703 | $30,735 |
| 2023 | $35,612 | $116,438 | $85,703 | $30,735 |
| 2022 | $35,612 | $116,438 | $85,703 | $30,735 |
| 2021 | $103,300 | $278,000 | $128,554 | $149,446 |
| 2020 | $101,923 | $278,000 | $128,554 | $149,446 |
| 2019 | $101,418 | $309,291 | $128,554 | $180,737 |
| 2018 | $72,197 | $201,956 | $101,772 | $100,184 |
| 2017 | $70,980 | $201,956 | $101,772 | $100,184 |
| 2016 | $66,276 | $201,956 | $101,772 | $100,184 |
| 2015 | $68,383 | $192,808 | $91,059 | $101,749 |
| 2014 | $67,516 | $192,808 | $91,059 | $101,749 |
| 2013 | $72,390 | $214,981 | $91,059 | $123,922 |
Source: Public Records
Map
Nearby Homes
- 1032 W Park Place Dr
- SWC Illinois Route 59
- 1105 Bluebell Ln
- 1107 Bluebell Ln
- 1109 Bluebell Ln
- 1111 Bluebell Ln
- 1115 Bluebell Ln
- 1108 Bluebell Ln
- 1116 Bluebell Ln
- 1112 Bluebell Ln
- 1114 Bluebell Ln
- 1110 Bluebell Ln
- 1118 Bluebell Ln
- 1203 Tiger Lily Dr
- 1208 Tiger Lily Dr
- 1211 Tiger Lily Dr
- 1219 Tiger Lily Dr
- 1216 Wildflower Ln
- 1235 Tiger Lily Dr
- 1232 Wildflower Ln
- 850 W Bartlett Rd Unit 15
- 852 W Bartlett Rd Unit 3
- 852 W Bartlett Rd
- 848 W Bartlett Rd Unit 1A
- 848 W Bartlett Rd Unit 14
- 848 W Bartlett Rd Unit 11
- 848 W Bartlett Rd Unit 1C
- 848 W Bartlett Rd
- 832 W Bartlett Rd
- 800 W Bartlett Rd Unit 800
- 840 W Bartlett Rd Unit 2
- 808 W Bartlett Rd Unit 1C
- 808 W Bartlett Rd Unit 1D
- 808 W Bartlett Rd Unit 2D
- 808 W Bartlett Rd Unit 1B
- 808 W Bartlett Rd
- 824 W Bartlett Rd
- 806 W Bartlett Rd
- 804 W Bartlett Rd
- 796 W Bartlett Rd
Your Personal Tour Guide
Ask me questions while you tour the home.