8500 Sand Dune Rd Nehalem, OR 97131
Estimated Value: $1,337,000 - $2,496,000
5
Beds
3
Baths
4,270
Sq Ft
$452/Sq Ft
Est. Value
About This Home
This home is located at 8500 Sand Dune Rd, Nehalem, OR 97131 and is currently estimated at $1,931,466, approximately $452 per square foot. 8500 Sand Dune Rd is a home located in Tillamook County with nearby schools including Nehalem Elementary School, Garibaldi Elementary School, and Neah-Kah-Nie Middle School.
Ownership History
Date
Name
Owned For
Owner Type
Purchase Details
Closed on
Oct 6, 2016
Sold by
Mucha Jeremy W and Mucha Sidney J
Bought by
8500 Sandune Llc
Current Estimated Value
Purchase Details
Closed on
Jul 13, 2015
Sold by
Bateman Craig E and Macgillivray Bonnie J
Bought by
Mucha Jeremy W and Mucha Sidney J
Purchase Details
Closed on
May 13, 2013
Sold by
Zocchi Karen V
Bought by
Bateman Craig E and Macgillivray Bonnie J
Purchase Details
Closed on
Apr 13, 2010
Sold by
Zocchi Karen V
Bought by
Zocchi Karen and Karen V Zocchi Trust
Create a Home Valuation Report for This Property
The Home Valuation Report is an in-depth analysis detailing your home's value as well as a comparison with similar homes in the area
Home Values in the Area
Average Home Value in this Area
Purchase History
| Date | Buyer | Sale Price | Title Company |
|---|---|---|---|
| 8500 Sandune Llc | -- | None Available | |
| Mucha Jeremy W | $1,100,000 | Ticor Title Company | |
| Bateman Craig E | $200,000 | None Available | |
| Zocchi Karen | -- | None Available |
Source: Public Records
Tax History Compared to Growth
Tax History
| Year | Tax Paid | Tax Assessment Tax Assessment Total Assessment is a certain percentage of the fair market value that is determined by local assessors to be the total taxable value of land and additions on the property. | Land | Improvement |
|---|---|---|---|---|
| 2024 | $11,961 | $996,410 | $299,150 | $697,260 |
| 2023 | $11,629 | $949,330 | $290,440 | $658,890 |
| 2022 | $10,940 | $921,680 | $281,980 | $639,700 |
| 2021 | $10,614 | $894,840 | $273,760 | $621,080 |
| 2020 | $10,194 | $868,780 | $265,790 | $602,990 |
| 2019 | $9,972 | $843,480 | $258,050 | $585,430 |
| 2018 | $6,407 | $537,860 | $249,140 | $288,720 |
| 2017 | $5,488 | $459,430 | $241,890 | $217,540 |
| 2016 | $5,332 | $446,050 | $234,850 | $211,200 |
| 2015 | $5,234 | $433,060 | $228,010 | $205,050 |
| 2014 | $5,147 | $420,450 | $221,370 | $199,080 |
| 2013 | -- | $408,210 | $214,930 | $193,280 |
Source: Public Records
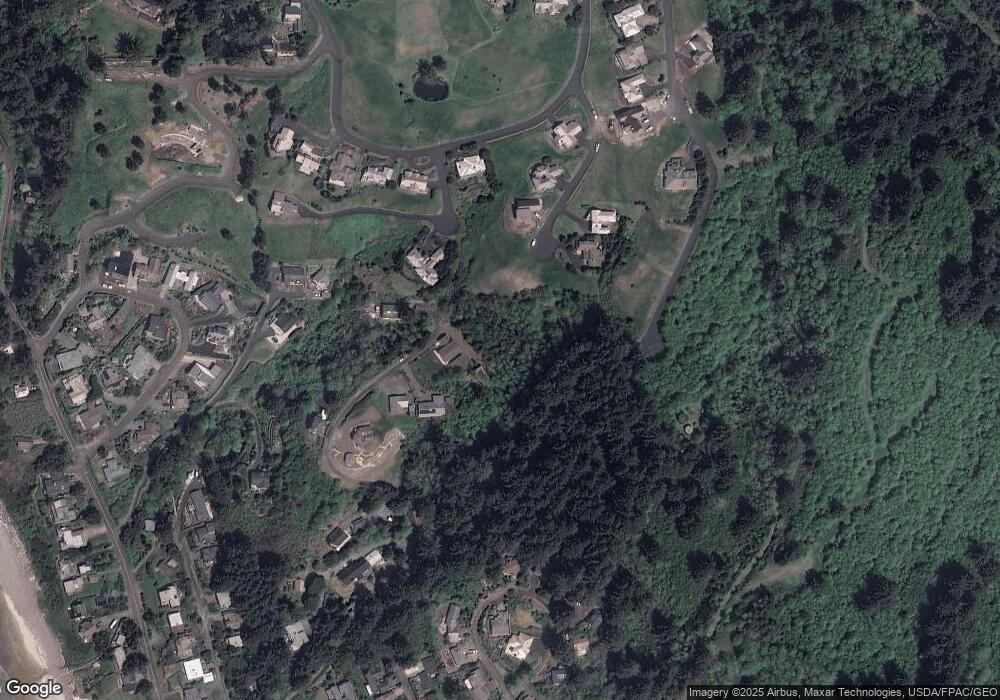
Map
Nearby Homes
- 8455 San Dune Rd
- 0 Tides Trail Unit 25-790
- 0 Tides Trail Unit 45 25-245
- 0 Tides Trail Unit Lot 45 462410636
- 46 Tides Trail
- 0 Vl Meadow Loop Unit 27
- 0 Via Bella Vista Unit Lot G 694315242
- VL Via Bella Vista
- 8720 Braeridge Dr
- 2000 Via Bella Vista Unit Lot B
- 2000 Via Bella Vista
- 0 Vantage Rd Unit TL 00503 24-220
- 0 Vantage Rd
- 0 Vantage Rd Unit TL 503 24135242
- 0 Braeridge Dr Unit 62 25-391
- 0 Braeridge Dr Unit 25-729
- 0 Braeridge Dr Unit Lot 62 192646082
- 0 Braeridge Dr Unit 10 24059622
- 8700 Braeridge Dr
- 37365 4th St
- 8500 San Dune Rd
- 8465 San Dune Rd
- 0 San Dune
- VL 4204 Tides Trail
- 8450 Sand Dune Rd
- 8450 San Dune Rd
- 8480 San Dune Rd
- 8800 Mariners Trail
- 8795 Tides Trail
- 8780 Tides Trail
- 8440 Sand Dune Rd
- 8785 Tides Trail Rd
- 8185 Blackberry Ln
- Lot 3 Beeswax
- 8770 Tides Trail
- 8770 Tides Trail
- 0 Tides Trail Unit 23608109
- 0 Tides Trail Unit 6-631
- 0 Tides Trail Unit 8-707
- 0 Tides Trail Unit 21578810