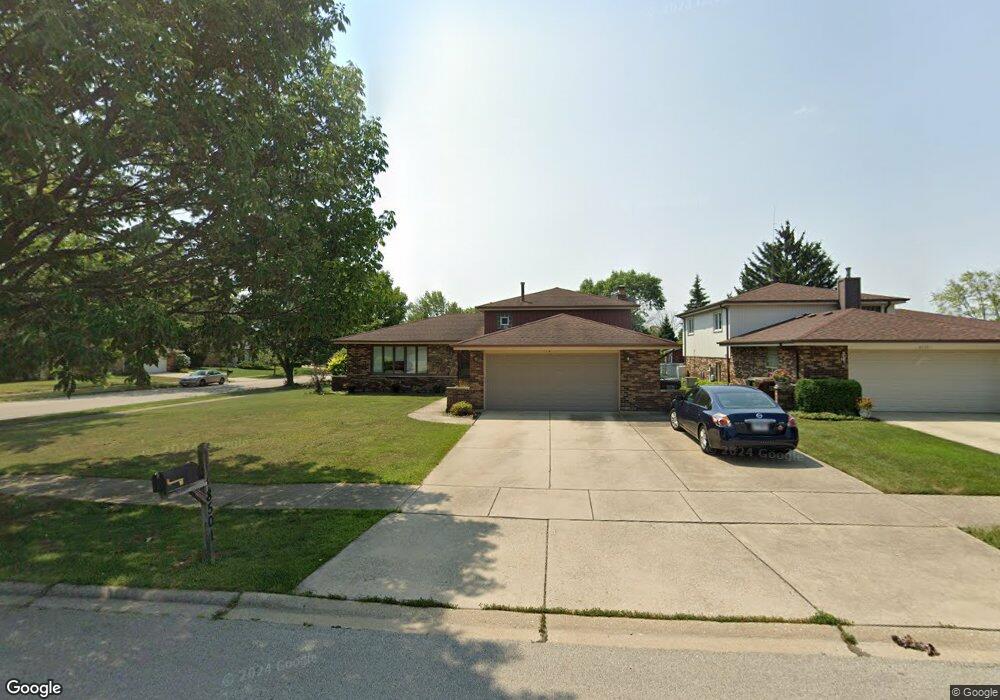
8501 165th Place Tinley Park, IL 60487
East Fernway Park NeighborhoodEstimated Value: $359,000 - $396,000
3
Beds
2
Baths
1,410
Sq Ft
$269/Sq Ft
Est. Value
About This Home
This home is located at 8501 165th Place, Tinley Park, IL 60487 and is currently estimated at $379,278, approximately $268 per square foot. 8501 165th Place is a home located in Cook County with nearby schools including Christa Mcauliffe School, Virgil I Grissom Middle School, and Victor J Andrew High School.
Ownership History
Date
Name
Owned For
Owner Type
Purchase Details
Closed on
Feb 26, 1999
Sold by
Busha Joanne J
Bought by
Yetter Steven P and Yetter Michelle B
Current Estimated Value
Home Financials for this Owner
Home Financials are based on the most recent Mortgage that was taken out on this home.
Original Mortgage
$163,600
Outstanding Balance
$39,865
Interest Rate
6.83%
Mortgage Type
FHA
Estimated Equity
$339,413
Purchase Details
Closed on
Apr 20, 1998
Sold by
Busha Timothy R
Bought by
Busha Joanne J
Purchase Details
Closed on
May 26, 1995
Sold by
Cassidy Ralph C and Cassidy Sheila J
Bought by
Busha Timothy R and Busha Joanne J
Home Financials for this Owner
Home Financials are based on the most recent Mortgage that was taken out on this home.
Original Mortgage
$124,400
Interest Rate
8.26%
Create a Home Valuation Report for This Property
The Home Valuation Report is an in-depth analysis detailing your home's value as well as a comparison with similar homes in the area
Home Values in the Area
Average Home Value in this Area
Purchase History
| Date | Buyer | Sale Price | Title Company |
|---|---|---|---|
| Yetter Steven P | $173,000 | Chicago Title Insurance Co | |
| Busha Joanne J | -- | Chicago Title Insurance Co | |
| Busha Timothy R | $155,500 | Attorneys Title Guaranty Fun |
Source: Public Records
Mortgage History
| Date | Status | Borrower | Loan Amount |
|---|---|---|---|
| Open | Yetter Steven P | $163,600 | |
| Previous Owner | Busha Timothy R | $124,400 |
Source: Public Records
Tax History Compared to Growth
Tax History
| Year | Tax Paid | Tax Assessment Tax Assessment Total Assessment is a certain percentage of the fair market value that is determined by local assessors to be the total taxable value of land and additions on the property. | Land | Improvement |
|---|---|---|---|---|
| 2024 | $8,242 | $33,000 | $6,002 | $26,998 |
| 2023 | $6,912 | $33,000 | $6,002 | $26,998 |
| 2022 | $6,912 | $22,808 | $4,617 | $18,191 |
| 2021 | $6,720 | $22,807 | $4,617 | $18,190 |
| 2020 | $6,622 | $22,807 | $4,617 | $18,190 |
| 2019 | $6,887 | $24,665 | $4,155 | $20,510 |
| 2018 | $6,738 | $24,665 | $4,155 | $20,510 |
| 2017 | $6,577 | $24,665 | $4,155 | $20,510 |
| 2016 | $5,977 | $20,493 | $3,693 | $16,800 |
| 2015 | $5,872 | $20,493 | $3,693 | $16,800 |
| 2014 | $5,839 | $20,493 | $3,693 | $16,800 |
| 2013 | $6,122 | $22,900 | $3,693 | $19,207 |
Source: Public Records
Map
Nearby Homes
- 16439 Cherry Hill Ave
- 8400 167th St
- 8564 Cherry Stone Place
- 8440 163rd St
- 16401 Tanbark Dr
- 8710 W 168th St
- 8319 161st Place
- 8721 W 169th St
- 8118 Tudor Ln
- 8316 161st Place Unit 1270
- 8249 161st Place
- 8135 Bormet Dr
- 16122 Pine Dr Unit 2476
- 16933 Richards Dr
- 8456 170th Place
- 16107 Eagle Ridge Dr Unit 3N
- 8832 170th St
- 16413 Prairie Dr
- 8735 Golden Rose Dr
- 8229 170th St Unit 8229
- 8515 165th Place
- 16548 Currant Ave
- 8459 165th Place
- 8523 165th Place
- 16541 Blossom Ln
- 16554 Currant Ave Unit 3
- 8508 165th Place
- 8500 165th Place
- 16549 Currant Ave
- 8516 165th Place
- 8516 165th Place
- 16547 Blossom Ln
- 8460 165th Place
- 8451 165th Place
- 16555 Currant Ave
- 16553 Blossom Ln
- 16561 Currant Ave Unit 3
- 16600 Currant Ave
- 16513 Blossom Ln
- 16532 Blossom Ln