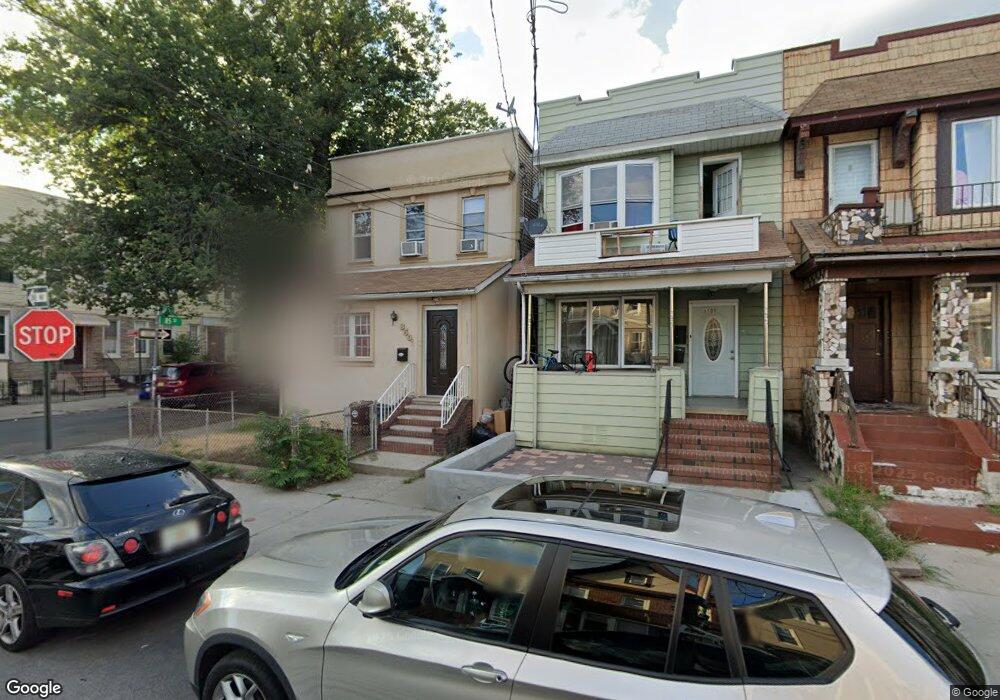
8501 89th Ave Woodhaven, NY 11421
Woodhaven NeighborhoodEstimated Value: $838,247 - $996,000
--
Bed
--
Bath
1,920
Sq Ft
$477/Sq Ft
Est. Value
About This Home
This home is located at 8501 89th Ave, Woodhaven, NY 11421 and is currently estimated at $916,562, approximately $477 per square foot. 8501 89th Ave is a home located in Queens County with nearby schools including P.S. 060 Woodhaven, Alice Ott Middle School, and Jhs 210 Elizabeth Blackwell.
Ownership History
Date
Name
Owned For
Owner Type
Purchase Details
Closed on
Sep 13, 2004
Sold by
Mahabir Allan
Bought by
Lopez Paula
Current Estimated Value
Purchase Details
Closed on
Jan 20, 1999
Sold by
Cornerstone Equities Inc
Bought by
Mahabir Allan
Home Financials for this Owner
Home Financials are based on the most recent Mortgage that was taken out on this home.
Original Mortgage
$194,377
Outstanding Balance
$44,152
Interest Rate
6.78%
Mortgage Type
FHA
Estimated Equity
$872,410
Purchase Details
Closed on
Jun 17, 1998
Sold by
Plunkett Bertha
Bought by
Cornerstone Equities Inc
Create a Home Valuation Report for This Property
The Home Valuation Report is an in-depth analysis detailing your home's value as well as a comparison with similar homes in the area
Home Values in the Area
Average Home Value in this Area
Purchase History
| Date | Buyer | Sale Price | Title Company |
|---|---|---|---|
| Lopez Paula | -- | -- | |
| Lopez Paula | -- | -- | |
| Mahabir Allan | $197,000 | Chicago Title Insurance Co | |
| Mahabir Allan | $197,000 | Chicago Title Insurance Co | |
| Cornerstone Equities Inc | $123,000 | Commonwealth Land Title Ins | |
| Cornerstone Equities Inc | $123,000 | Commonwealth Land Title Ins |
Source: Public Records
Mortgage History
| Date | Status | Borrower | Loan Amount |
|---|---|---|---|
| Open | Mahabir Allan | $194,377 | |
| Closed | Mahabir Allan | $194,377 | |
| Closed | Lopez Paula | $0 |
Source: Public Records
Tax History Compared to Growth
Tax History
| Year | Tax Paid | Tax Assessment Tax Assessment Total Assessment is a certain percentage of the fair market value that is determined by local assessors to be the total taxable value of land and additions on the property. | Land | Improvement |
|---|---|---|---|---|
| 2025 | $6,962 | $36,743 | $9,567 | $27,176 |
| 2024 | $6,962 | $34,664 | $9,800 | $24,864 |
| 2023 | $6,569 | $32,704 | $10,163 | $22,541 |
| 2022 | $6,159 | $48,060 | $15,420 | $32,640 |
| 2021 | $6,493 | $40,440 | $15,420 | $25,020 |
| 2020 | $6,481 | $40,080 | $15,420 | $24,660 |
| 2019 | $6,043 | $43,560 | $15,420 | $28,140 |
| 2018 | $5,556 | $27,253 | $11,634 | $15,619 |
| 2017 | $5,241 | $25,712 | $11,906 | $13,806 |
| 2016 | $5,140 | $25,712 | $11,906 | $13,806 |
| 2015 | $2,926 | $25,516 | $15,342 | $10,174 |
| 2014 | $2,926 | $24,073 | $14,723 | $9,350 |
Source: Public Records
Map
Nearby Homes
- 8503 89th Ave
- 85-03 89th Ave Unit 2nd Fl
- 85-03 89th Ave Unit 1st Fl
- 8503 89th Ave Unit 2nd Fl
- 8503 89th Ave Unit 1st Fl
- 85-13 89th Ave
- 8505 89th Ave
- 8507 89th Ave
- 8831 85th St Unit 2R
- 8831 85th St
- 89-07 85th St
- 8509 89th Ave
- 88-34 85th St Unit 4 Family h
- 88-34 85th St
- 88-29 85th St Unit 2 Fl
- 8829 85th St
- 8511 89th Ave
- 8836 85th St
- 8840 85th St
- 8834 85th St