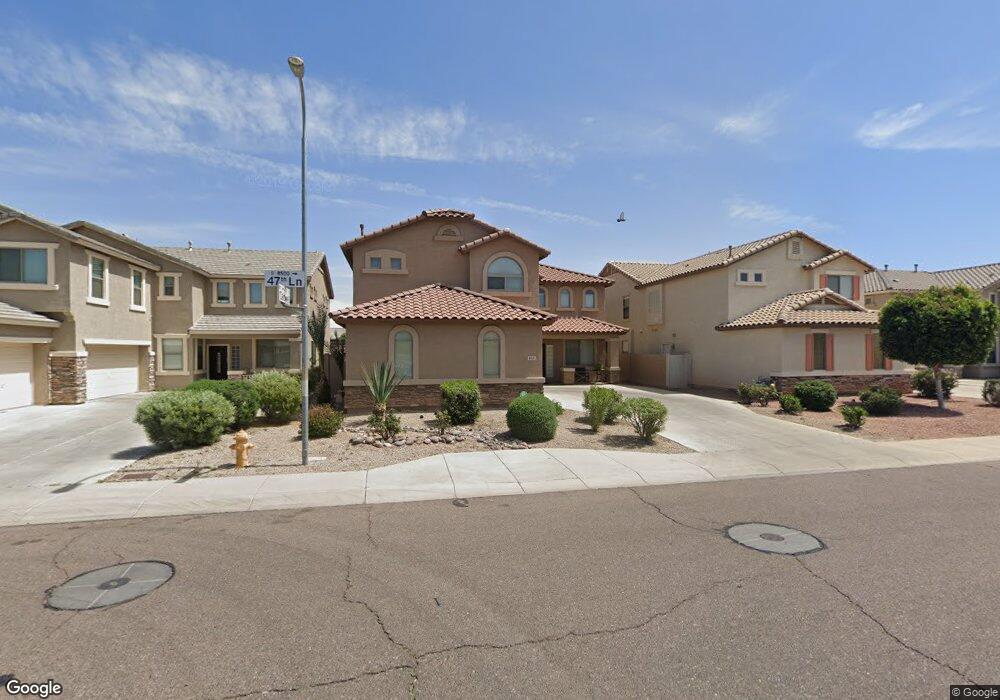
8501 S 47th Ln Laveen, AZ 85339
Laveen NeighborhoodEstimated Value: $456,000 - $562,000
5
Beds
3
Baths
2,974
Sq Ft
$168/Sq Ft
Est. Value
About This Home
This home is located at 8501 S 47th Ln, Laveen, AZ 85339 and is currently estimated at $499,900, approximately $168 per square foot. 8501 S 47th Ln is a home located in Maricopa County with nearby schools including Betty Fairfax High School, Phoenix Coding Academy, and Legacy Traditional School - Laveen Village.
Ownership History
Date
Name
Owned For
Owner Type
Purchase Details
Closed on
Mar 25, 2010
Sold by
Jarr Equity Group
Bought by
Nigro Norman and Johnson Vicki
Current Estimated Value
Home Financials for this Owner
Home Financials are based on the most recent Mortgage that was taken out on this home.
Original Mortgage
$120,000
Outstanding Balance
$79,374
Interest Rate
4.94%
Mortgage Type
New Conventional
Estimated Equity
$420,526
Purchase Details
Closed on
Oct 26, 2009
Sold by
Ez Homes Inc
Bought by
Jarr Equity Group
Purchase Details
Closed on
Oct 14, 2009
Sold by
Li Ming
Bought by
Ez Homes
Purchase Details
Closed on
Sep 29, 2006
Sold by
Jiang Min M
Bought by
Li Ming
Home Financials for this Owner
Home Financials are based on the most recent Mortgage that was taken out on this home.
Original Mortgage
$230,032
Interest Rate
6.5%
Mortgage Type
New Conventional
Create a Home Valuation Report for This Property
The Home Valuation Report is an in-depth analysis detailing your home's value as well as a comparison with similar homes in the area
Home Values in the Area
Average Home Value in this Area
Purchase History
| Date | Buyer | Sale Price | Title Company |
|---|---|---|---|
| Nigro Norman | $160,000 | Fidelity Natl Title Ins Co | |
| Jarr Equity Group | -- | None Available | |
| Ez Homes | $140,000 | None Available | |
| Li Ming | -- | Dhi Title Of Arizona Inc | |
| Li Ming | $287,541 | Dhi Title Of Arizona Inc | |
| Continental Homes Inc | -- | Dhi Title Of Arizona Inc |
Source: Public Records
Mortgage History
| Date | Status | Borrower | Loan Amount |
|---|---|---|---|
| Open | Nigro Norman | $120,000 | |
| Previous Owner | Continental Homes Inc | $230,032 |
Source: Public Records
Tax History Compared to Growth
Tax History
| Year | Tax Paid | Tax Assessment Tax Assessment Total Assessment is a certain percentage of the fair market value that is determined by local assessors to be the total taxable value of land and additions on the property. | Land | Improvement |
|---|---|---|---|---|
| 2025 | $2,843 | $18,438 | -- | -- |
| 2024 | $2,792 | $17,560 | -- | -- |
| 2023 | $2,792 | $34,680 | $6,930 | $27,750 |
| 2022 | $2,712 | $26,270 | $5,250 | $21,020 |
| 2021 | $2,712 | $24,860 | $4,970 | $19,890 |
| 2020 | $2,644 | $23,100 | $4,620 | $18,480 |
| 2019 | $2,646 | $20,960 | $4,190 | $16,770 |
| 2018 | $2,526 | $19,970 | $3,990 | $15,980 |
| 2017 | $2,397 | $17,830 | $3,560 | $14,270 |
| 2016 | $2,282 | $16,720 | $3,340 | $13,380 |
| 2015 | $1,845 | $16,650 | $3,330 | $13,320 |
Source: Public Records
Map
Nearby Homes
- 8616 S 46th Ln
- 8222 S Jenna Ln
- 8615 S 45th Glen
- 6951 W Pedro Ln
- 6838 W Pedro Ln
- 8213 S Jenna Ln
- 8431 S 50th Dr
- 4931 W Desert Dr
- 4933 W Melody Ln
- 4605 W Beverly Rd Unit 2
- 4730 W Fawn Dr
- 4939 W Harwell Rd
- 4534 W Fawn Dr
- 4803 W Beautiful Ln
- 4539 W Beautiful Ln
- 5220 W Desert Ln
- 4429 W Paseo Way
- 4217 W Allen St
- 5124 W Fawn Dr
- 5237 W Ian Dr
- 8509 S 47th Ln
- 8513 S 47th Ln
- 8411 S 47th Ln
- 4725 W Caldwell St
- 8407 S 47th Ln
- 8517 S 47th Ln
- 8412 S 47th Ln
- 4724 W Ardmore Rd
- 4729 W Caldwell St
- 8408 S 47th Ln
- 8521 S 47th Ln
- 4728 W Ardmore Rd
- 4733 W Caldwell St
- 8404 S 47th Ln
- 8413 S 48th Dr
- 4717 W Ardmore Rd
- 4732 W Ardmore Rd
- 4737 W Caldwell St
- 4721 W Ardmore Rd
- 8409 S 48th Dr