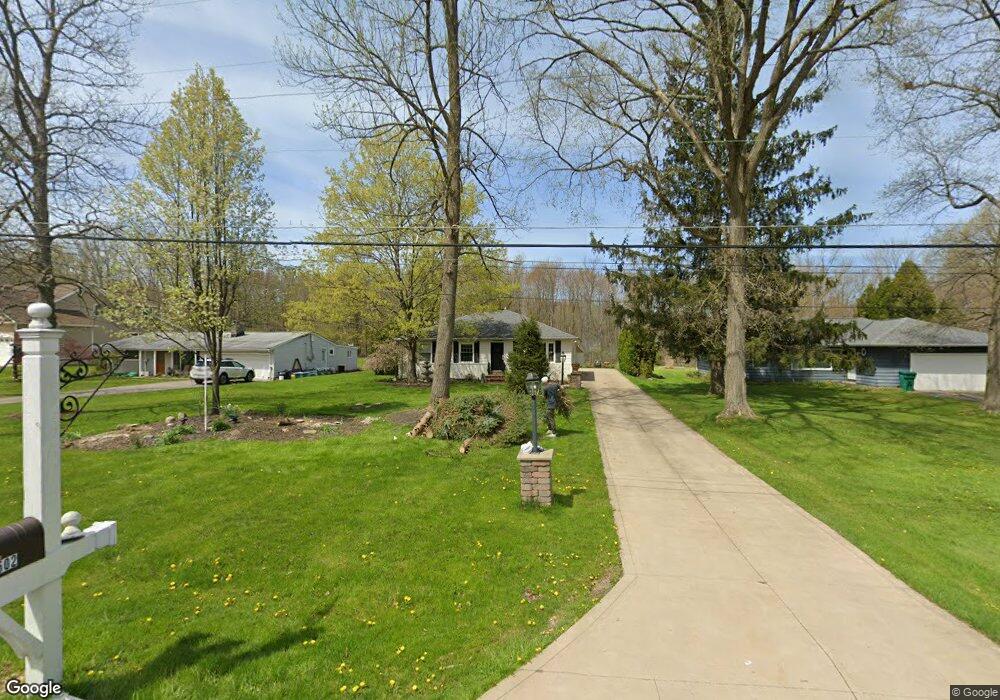
8502 Sharp Ln Chesterland, OH 44026
Estimated Value: $302,000 - $341,000
4
Beds
2
Baths
1,920
Sq Ft
$165/Sq Ft
Est. Value
About This Home
This home is located at 8502 Sharp Ln, Chesterland, OH 44026 and is currently estimated at $317,481, approximately $165 per square foot. 8502 Sharp Ln is a home located in Geauga County with nearby schools including West Geauga High School and St Anselm School.
Ownership History
Date
Name
Owned For
Owner Type
Purchase Details
Closed on
Mar 16, 2021
Sold by
Kosley Matthew R
Bought by
Kosley Josephine
Current Estimated Value
Home Financials for this Owner
Home Financials are based on the most recent Mortgage that was taken out on this home.
Original Mortgage
$199,500
Outstanding Balance
$176,383
Interest Rate
2.7%
Mortgage Type
New Conventional
Estimated Equity
$141,098
Purchase Details
Closed on
Mar 15, 2021
Sold by
Kosley Josephine
Bought by
Kosley Nicholas A
Home Financials for this Owner
Home Financials are based on the most recent Mortgage that was taken out on this home.
Original Mortgage
$199,500
Outstanding Balance
$176,383
Interest Rate
2.7%
Mortgage Type
New Conventional
Estimated Equity
$141,098
Purchase Details
Closed on
Mar 12, 2021
Sold by
Kosley Matthew R
Bought by
Kosley Josephine
Home Financials for this Owner
Home Financials are based on the most recent Mortgage that was taken out on this home.
Original Mortgage
$199,500
Outstanding Balance
$176,383
Interest Rate
2.7%
Mortgage Type
New Conventional
Estimated Equity
$141,098
Purchase Details
Closed on
Sep 16, 1993
Bought by
Kosley Matthew R
Create a Home Valuation Report for This Property
The Home Valuation Report is an in-depth analysis detailing your home's value as well as a comparison with similar homes in the area
Home Values in the Area
Average Home Value in this Area
Purchase History
| Date | Buyer | Sale Price | Title Company |
|---|---|---|---|
| Kosley Josephine | -- | None Listed On Document | |
| Kosley Nicholas A | $210,000 | None Available | |
| Kosley Nicholas A | -- | None Listed On Document | |
| Kosley Josephine | -- | None Available | |
| Kosley Matthew R | $95,500 | -- |
Source: Public Records
Mortgage History
| Date | Status | Borrower | Loan Amount |
|---|---|---|---|
| Open | Kosley Josephine | $199,500 | |
| Closed | Kosley Nicholas A | $199,500 |
Source: Public Records
Tax History
| Year | Tax Paid | Tax Assessment Tax Assessment Total Assessment is a certain percentage of the fair market value that is determined by local assessors to be the total taxable value of land and additions on the property. | Land | Improvement |
|---|---|---|---|---|
| 2025 | $3,924 | $86,280 | $11,870 | $74,410 |
| 2024 | $3,924 | $86,280 | $11,870 | $74,410 |
| 2023 | $3,722 | $86,280 | $11,870 | $74,410 |
| 2022 | $3,113 | $61,920 | $9,870 | $52,050 |
| 2021 | $3,104 | $61,920 | $9,870 | $52,050 |
| 2020 | $3,226 | $61,920 | $9,870 | $52,050 |
| 2019 | $2,973 | $55,130 | $9,870 | $45,260 |
| 2018 | $2,949 | $55,130 | $9,870 | $45,260 |
| 2017 | $2,973 | $55,130 | $9,870 | $45,260 |
| 2016 | $2,837 | $49,740 | $9,450 | $40,290 |
| 2015 | $2,627 | $49,740 | $9,450 | $40,290 |
| 2014 | $2,627 | $49,740 | $9,450 | $40,290 |
| 2013 | $2,646 | $49,740 | $9,450 | $40,290 |
Source: Public Records
Map
Nearby Homes
- VL Palomino Trail
- 8367 Kirkwood Dr
- 10831 Chillicothe Rd
- 10900 Angela Dr
- 10899 Tibbetts Rd
- 10405 Chillicothe Rd
- 7454 Euclid Chardon Rd
- 10548 Briar Hill Dr
- 11765 Sherwood Trail
- 8301 Sherman Rd
- 9735 Deerfield Place
- 9735 Chillicothe Rd
- 9735 Chillicothe Rd Unit 54
- 9735 Chillicothe Rd Unit 29
- 9735 Chillicothe Rd Unit 30
- 8323 Eagle Rd Unit 52
- 8323 Eagle Rd Unit 44
- 8323 Eagle Rd Unit LOT 37
- 8323 Eagle Rd Unit 28
- 8323 Eagle Rd Unit 22
Your Personal Tour Guide
Ask me questions while you tour the home.