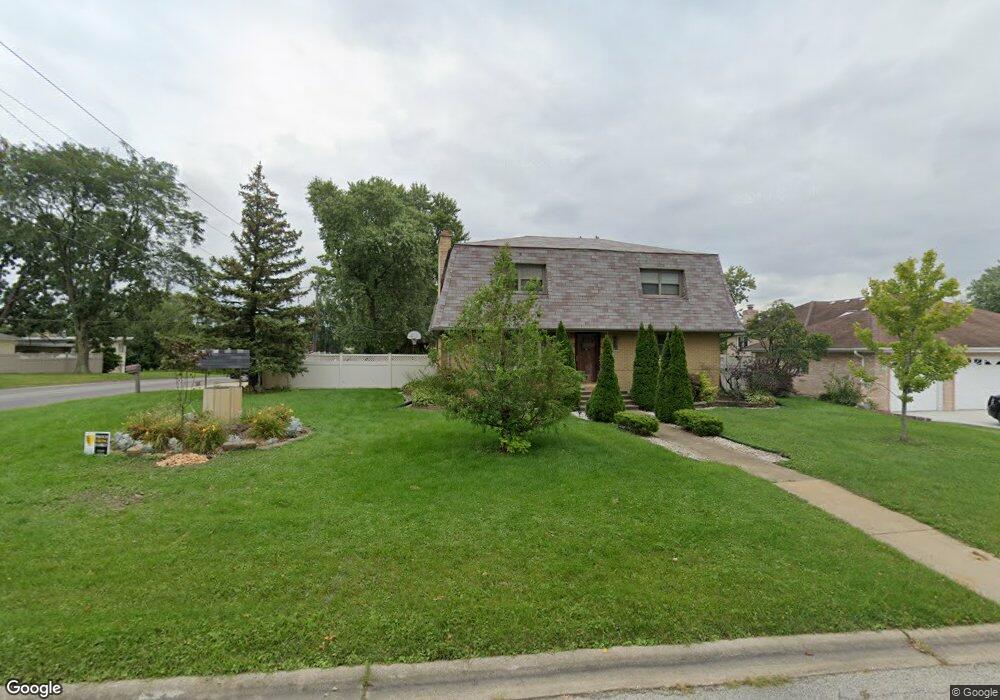
8505 S 83rd Ave Hickory Hills, IL 60457
Estimated Value: $449,000 - $560,000
4
Beds
2
Baths
2,600
Sq Ft
$187/Sq Ft
Est. Value
About This Home
This home is located at 8505 S 83rd Ave, Hickory Hills, IL 60457 and is currently estimated at $486,642, approximately $187 per square foot. 8505 S 83rd Ave is a home located in Cook County with nearby schools including Frank A Brodnicki Elementary School, Argo Community High School, and St. Patricia School.
Ownership History
Date
Name
Owned For
Owner Type
Purchase Details
Closed on
Jan 10, 2003
Sold by
Hazard Paul and Hazard Kris
Bought by
Garibay Jose G and Garibay Irene
Current Estimated Value
Home Financials for this Owner
Home Financials are based on the most recent Mortgage that was taken out on this home.
Original Mortgage
$175,750
Outstanding Balance
$74,540
Interest Rate
5.94%
Estimated Equity
$412,102
Purchase Details
Closed on
Sep 2, 1999
Sold by
The Cit Group/Consumer Finance Corp
Bought by
Hazard Paul
Home Financials for this Owner
Home Financials are based on the most recent Mortgage that was taken out on this home.
Original Mortgage
$114,000
Interest Rate
7.93%
Purchase Details
Closed on
Jan 22, 1998
Sold by
Eischen Timothy J and Eischen Margaret A
Bought by
Youcef Achaira Bensaid
Home Financials for this Owner
Home Financials are based on the most recent Mortgage that was taken out on this home.
Original Mortgage
$128,800
Interest Rate
7.24%
Create a Home Valuation Report for This Property
The Home Valuation Report is an in-depth analysis detailing your home's value as well as a comparison with similar homes in the area
Home Values in the Area
Average Home Value in this Area
Purchase History
| Date | Buyer | Sale Price | Title Company |
|---|---|---|---|
| Garibay Jose G | $185,000 | -- | |
| Hazard Paul | $142,500 | Law Title | |
| Youcef Achaira Bensaid | $161,000 | -- |
Source: Public Records
Mortgage History
| Date | Status | Borrower | Loan Amount |
|---|---|---|---|
| Open | Garibay Jose G | $175,750 | |
| Previous Owner | Hazard Paul | $114,000 | |
| Previous Owner | Youcef Achaira Bensaid | $128,800 | |
| Closed | Hazard Paul | $14,250 |
Source: Public Records
Tax History Compared to Growth
Tax History
| Year | Tax Paid | Tax Assessment Tax Assessment Total Assessment is a certain percentage of the fair market value that is determined by local assessors to be the total taxable value of land and additions on the property. | Land | Improvement |
|---|---|---|---|---|
| 2024 | $9,829 | $34,000 | $5,586 | $28,414 |
| 2023 | $8,499 | $34,000 | $5,586 | $28,414 |
| 2022 | $8,499 | $25,963 | $4,788 | $21,175 |
| 2021 | $7,978 | $25,962 | $4,788 | $21,174 |
| 2020 | $7,746 | $25,962 | $4,788 | $21,174 |
| 2019 | $9,303 | $28,761 | $4,256 | $24,505 |
| 2018 | $8,873 | $28,761 | $4,256 | $24,505 |
| 2017 | $8,824 | $28,761 | $4,256 | $24,505 |
| 2016 | $9,585 | $28,459 | $3,724 | $24,735 |
| 2015 | $9,293 | $28,459 | $3,724 | $24,735 |
| 2014 | $9,167 | $28,459 | $3,724 | $24,735 |
| 2013 | $9,275 | $31,041 | $3,724 | $27,317 |
Source: Public Records
Map
Nearby Homes
- 8462 S 83rd Ave
- 8543 S 83rd Ave
- 8564 S 83rd Ave
- 8302 W 87th St
- 8400 W 87th St
- 8506 S 85th Ct
- 8059 W 84th St Unit 3N
- 8545 S Roberts Rd
- 8518 S 79th Ct
- 8450 S 79th Ct
- 7330 S 86th Ave
- 8304 S 79th Ct
- 8300 S 79th Ct
- 8931 S 83rd Ct
- 8332 S 78th Ct
- 8020 S 83rd Ct
- 8410 S 78th Ave
- 7837 W 82nd Place
- 8901 S Roberts Rd Unit 104
- 8810 W 83rd Place