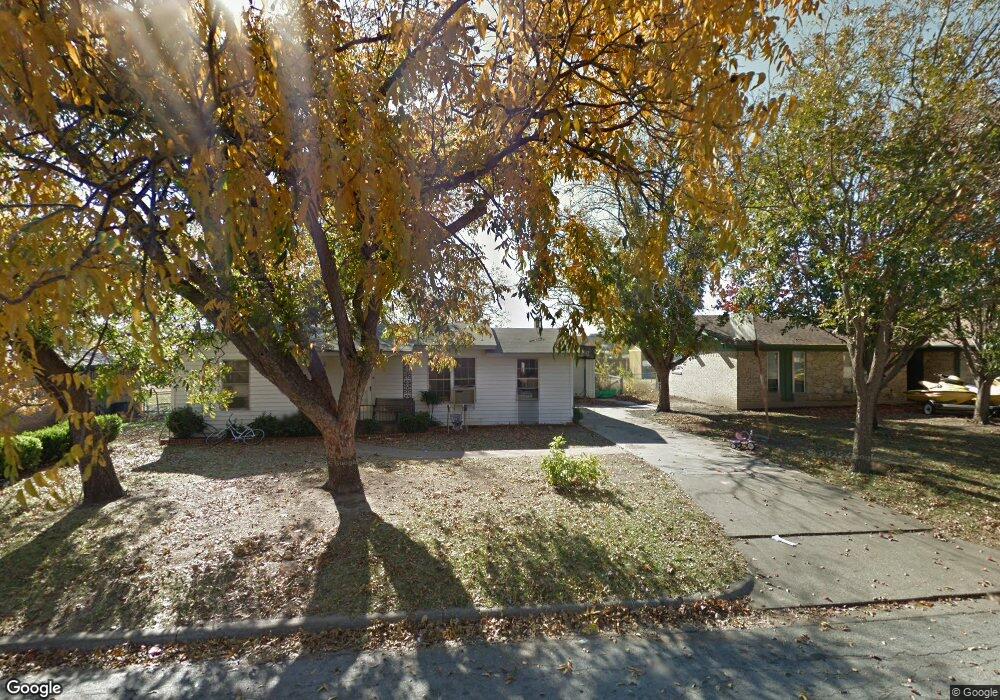
8505 Wilbur St Fort Worth, TX 76108
Estimated Value: $203,000 - $236,000
2
Beds
2
Baths
1,096
Sq Ft
$204/Sq Ft
Est. Value
About This Home
This home is located at 8505 Wilbur St, Fort Worth, TX 76108 and is currently estimated at $223,114, approximately $203 per square foot. 8505 Wilbur St is a home located in Tarrant County with nearby schools including North Elementary School, Brewer Middle School, and Tannahill Intermediate School.
Ownership History
Date
Name
Owned For
Owner Type
Purchase Details
Closed on
Sep 15, 2017
Sold by
Entrusted Dreams Llc
Bought by
Cooper Chad
Current Estimated Value
Home Financials for this Owner
Home Financials are based on the most recent Mortgage that was taken out on this home.
Original Mortgage
$100,000
Outstanding Balance
$83,574
Interest Rate
3.93%
Mortgage Type
New Conventional
Estimated Equity
$139,540
Purchase Details
Closed on
Jun 15, 2016
Sold by
Heb Homes Llc
Bought by
Entrusted Dreams Llc
Home Financials for this Owner
Home Financials are based on the most recent Mortgage that was taken out on this home.
Original Mortgage
$65,000
Interest Rate
3.58%
Mortgage Type
Purchase Money Mortgage
Purchase Details
Closed on
Jan 6, 2016
Sold by
Reverse Mortgage Solutions Inc
Bought by
Federal National Mortgage Association
Purchase Details
Closed on
Dec 1, 2015
Sold by
Holloway Bernice Todd
Bought by
Reverse Mortgage Solutions Inc
Create a Home Valuation Report for This Property
The Home Valuation Report is an in-depth analysis detailing your home's value as well as a comparison with similar homes in the area
Home Values in the Area
Average Home Value in this Area
Purchase History
| Date | Buyer | Sale Price | Title Company |
|---|---|---|---|
| Cooper Chad | -- | None Available | |
| Entrusted Dreams Llc | -- | None Available | |
| Heb Homes Llc | -- | None Available | |
| Federal National Mortgage Association | -- | Attorney | |
| Reverse Mortgage Solutions Inc | $58,823 | None Available |
Source: Public Records
Mortgage History
| Date | Status | Borrower | Loan Amount |
|---|---|---|---|
| Open | Cooper Chad | $100,000 | |
| Previous Owner | Heb Homes Llc | $65,000 |
Source: Public Records
Tax History Compared to Growth
Tax History
| Year | Tax Paid | Tax Assessment Tax Assessment Total Assessment is a certain percentage of the fair market value that is determined by local assessors to be the total taxable value of land and additions on the property. | Land | Improvement |
|---|---|---|---|---|
| 2025 | $2,794 | $234,788 | $39,810 | $194,978 |
| 2024 | $2,794 | $234,788 | $39,810 | $194,978 |
| 2023 | $4,011 | $235,760 | $39,810 | $195,950 |
| 2022 | $4,153 | $201,795 | $25,000 | $176,795 |
| 2021 | $3,835 | $178,016 | $25,000 | $153,016 |
| 2020 | $3,512 | $159,168 | $25,000 | $134,168 |
| 2019 | $3,315 | $152,571 | $25,000 | $127,571 |
| 2018 | $3,013 | $104,747 | $11,000 | $93,747 |
| 2017 | $2,730 | $93,411 | $11,000 | $82,411 |
| 2016 | $3,049 | $104,345 | $11,000 | $93,345 |
| 2015 | $207 | $55,000 | $11,000 | $44,000 |
| 2014 | $207 | $55,000 | $11,000 | $44,000 |
Source: Public Records
Map
Nearby Homes
- 8401 Clifford St
- 633 Lariat Ln
- 8814 Rockway St
- 627 Hallvale Dr
- 304 Lockwood St
- 8133 Foxfire Ln
- 311 Russell St
- 8113 Foxfire Ln
- 308 Hallvale Dr
- 813 Hackamore St
- 8814 Clifford St
- 8321 Raymond Ave
- 203 East Place
- 8811 Silver Creek Rd
- 200 Waynell St
- 7945 White Settlement Rd
- 105 Lockwood St
- 8417 Omaha Dr
- 9005 Glenn Dr
- 201 N Normandale St