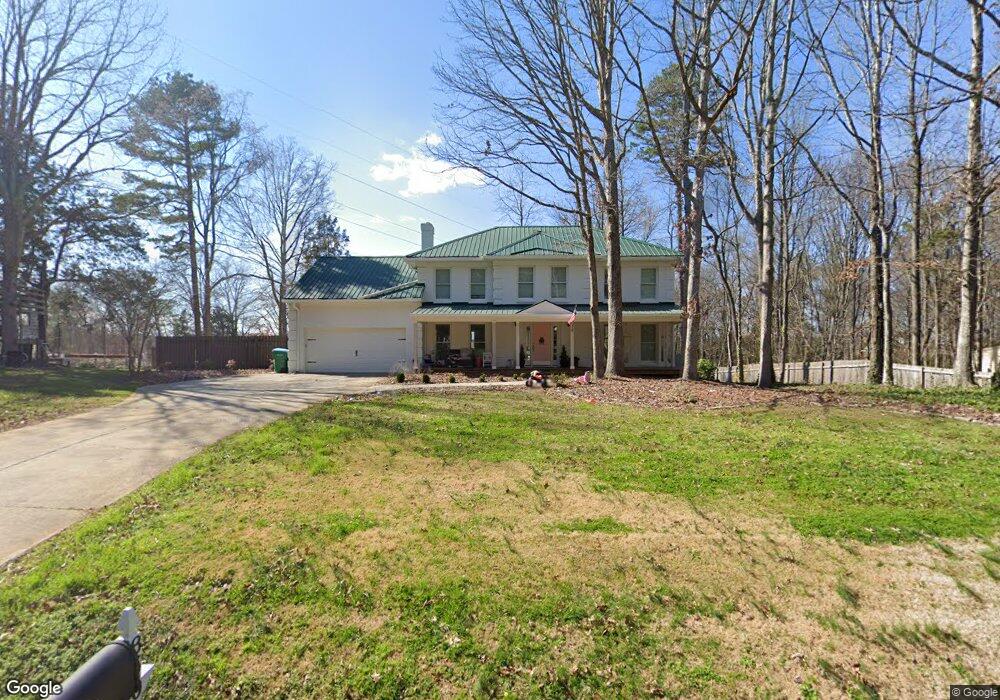
8506 Piccadily Ln Harrisburg, NC 28075
Estimated Value: $535,000 - $541,000
4
Beds
3
Baths
2,318
Sq Ft
$232/Sq Ft
Est. Value
About This Home
This home is located at 8506 Piccadily Ln, Harrisburg, NC 28075 and is currently estimated at $536,936, approximately $231 per square foot. 8506 Piccadily Ln is a home located in Cabarrus County with nearby schools including Harrisburg Elementary School, Hickory Ridge Middle, and Hickory Ridge High School.
Ownership History
Date
Name
Owned For
Owner Type
Purchase Details
Closed on
Dec 20, 2012
Sold by
Bms Investments Properties Llc
Bought by
George Rufty Mark Edward and Rufty Ashley Brooke
Current Estimated Value
Home Financials for this Owner
Home Financials are based on the most recent Mortgage that was taken out on this home.
Original Mortgage
$210,500
Outstanding Balance
$145,773
Interest Rate
3.36%
Mortgage Type
VA
Estimated Equity
$391,163
Purchase Details
Closed on
Jun 5, 2012
Sold by
Kania Richard J
Bought by
Bms Investment Properties Llc
Home Financials for this Owner
Home Financials are based on the most recent Mortgage that was taken out on this home.
Original Mortgage
$111,979
Interest Rate
3.86%
Mortgage Type
New Conventional
Purchase Details
Closed on
Feb 1, 1996
Bought by
Ferrell Charles T
Purchase Details
Closed on
Jul 1, 1991
Purchase Details
Closed on
Jul 1, 1987
Create a Home Valuation Report for This Property
The Home Valuation Report is an in-depth analysis detailing your home's value as well as a comparison with similar homes in the area
Home Values in the Area
Average Home Value in this Area
Purchase History
| Date | Buyer | Sale Price | Title Company |
|---|---|---|---|
| George Rufty Mark Edward | $211,000 | None Available | |
| Bms Investment Properties Llc | $72,000 | None Available | |
| Ferrell Charles T | $148,000 | -- | |
| -- | $134,500 | -- | |
| -- | $131,000 | -- |
Source: Public Records
Mortgage History
| Date | Status | Borrower | Loan Amount |
|---|---|---|---|
| Open | George Rufty Mark Edward | $210,500 | |
| Previous Owner | Bms Investment Properties Llc | $111,979 |
Source: Public Records
Tax History Compared to Growth
Tax History
| Year | Tax Paid | Tax Assessment Tax Assessment Total Assessment is a certain percentage of the fair market value that is determined by local assessors to be the total taxable value of land and additions on the property. | Land | Improvement |
|---|---|---|---|---|
| 2025 | $4,749 | $481,660 | $60,000 | $421,660 |
| 2024 | $4,749 | $481,660 | $60,000 | $421,660 |
| 2023 | $3,220 | $307,190 | $55,000 | $252,190 |
| 2022 | $3,220 | $274,080 | $55,000 | $219,080 |
| 2021 | $3,001 | $274,080 | $55,000 | $219,080 |
| 2020 | $3,001 | $274,080 | $55,000 | $219,080 |
| 2019 | $2,421 | $221,080 | $26,600 | $194,480 |
| 2018 | $2,377 | $221,080 | $26,600 | $194,480 |
| 2017 | $2,189 | $221,080 | $26,600 | $194,480 |
| 2016 | $2,189 | $206,380 | $26,600 | $179,780 |
| 2015 | -- | $206,380 | $26,600 | $179,780 |
| 2014 | -- | $206,380 | $26,600 | $179,780 |
Source: Public Records
Map
Nearby Homes
- 4235 Coulter Crossing
- 440 Nathaniel Dale Place Unit BRX0041
- 437 Nathaniel Dale Place Unit BRX0034
- 429 Nathaniel Dale Place Unit BRX0032
- 408 Nathaniel Dale Place Unit BRX0053
- 412 Nathaniel Dale Place Unit BRX0052
- 4214 Coulter Crossing
- 8320 Camelot Dr
- 4208 Coulter Crossing
- 8817 Arrington Hall
- 5116 Sunburst Ln
- 1139 Grays Mill Rd
- 6010 Albiza Dr
- 5730 Clear Creek Ln
- 8015 Frances Haven Dr
- 8928 Morning Mist Rd
- 8915 Merrie Rose Ave
- 5840 Coulee Ln
- 9131 Harwen Ln Unit 32
- 3317 Wymering Rd
- 8513 Piccadily Ln
- 8500 Piccadily Ln
- 8512 Piccadily Ln
- 8507 Piccadily Ln
- 8424 Piccadily Ln
- 8518 Piccadily Ln
- 8425 Piccadily Ln
- 5905 River Meadow Ct Unit 19
- 5701 Dorchester Ave
- 5909 River Meadow Ct
- 8418 Piccadily Ln
- 5706 Dorchester Ave
- 5913 River Meadow Ct
- 5016 Sunburst Ln
- 5020 Sunburst Ln
- 5706 Manchester Ave
- 5917 River Meadow Ct
- 5914 River Meadow Ct
- 8600 Piccadily Ln
- 5921 River Meadow Ct