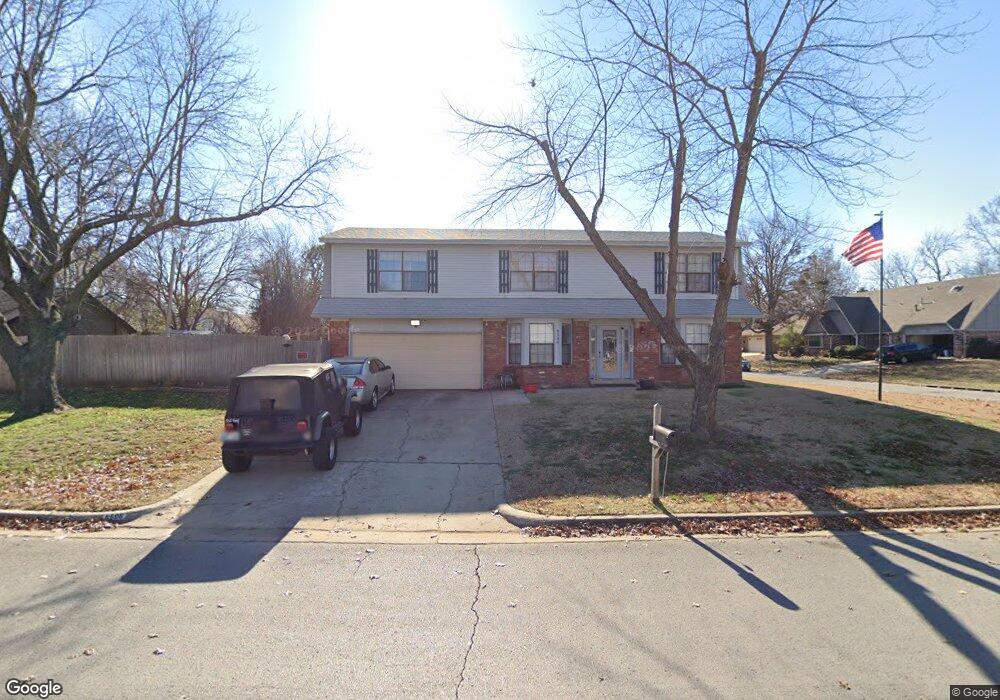
8508 E 75th St Tulsa, OK 74133
Woodlands NeighborhoodEstimated Value: $281,267 - $308,000
4
Beds
2
Baths
2,454
Sq Ft
$122/Sq Ft
Est. Value
About This Home
This home is located at 8508 E 75th St, Tulsa, OK 74133 and is currently estimated at $298,317, approximately $121 per square foot. 8508 E 75th St is a home located in Tulsa County with nearby schools including Jarman Elementary School, Union 6th-7th Grade Center, and Union 8th Grade Center.
Ownership History
Date
Name
Owned For
Owner Type
Purchase Details
Closed on
Jan 31, 2019
Sold by
Kissinger Jason S and Kissinger Shawna D
Bought by
Stout Alfred C
Current Estimated Value
Home Financials for this Owner
Home Financials are based on the most recent Mortgage that was taken out on this home.
Original Mortgage
$165,899
Outstanding Balance
$144,971
Interest Rate
4.5%
Mortgage Type
VA
Estimated Equity
$153,346
Purchase Details
Closed on
May 27, 2011
Sold by
Sumrall Family Living Trust
Bought by
Kissinger Jason S
Home Financials for this Owner
Home Financials are based on the most recent Mortgage that was taken out on this home.
Original Mortgage
$169,750
Interest Rate
4.95%
Mortgage Type
FHA
Purchase Details
Closed on
Sep 26, 2008
Sold by
Sumrall Charles Dav Id
Bought by
Sumrall Family Living Trust
Purchase Details
Closed on
Jan 16, 2003
Sold by
Sumrall Dana L and Barnett Dana L
Bought by
Sumrall Charles D
Purchase Details
Closed on
Jul 1, 1991
Create a Home Valuation Report for This Property
The Home Valuation Report is an in-depth analysis detailing your home's value as well as a comparison with similar homes in the area
Home Values in the Area
Average Home Value in this Area
Purchase History
| Date | Buyer | Sale Price | Title Company |
|---|---|---|---|
| Stout Alfred C | $161,000 | American Eagle Title Group L | |
| Kissinger Jason S | $175,000 | Oklahoma Title & Escrow Corp | |
| Sumrall Family Living Trust | -- | None Available | |
| Sumrall Charles D | -- | -- | |
| -- | $95,000 | -- |
Source: Public Records
Mortgage History
| Date | Status | Borrower | Loan Amount |
|---|---|---|---|
| Open | Stout Alfred C | $165,899 | |
| Previous Owner | Kissinger Jason S | $169,750 |
Source: Public Records
Tax History Compared to Growth
Tax History
| Year | Tax Paid | Tax Assessment Tax Assessment Total Assessment is a certain percentage of the fair market value that is determined by local assessors to be the total taxable value of land and additions on the property. | Land | Improvement |
|---|---|---|---|---|
| 2025 | $2,943 | $21,526 | $2,162 | $19,364 |
| 2024 | $2,497 | $20,501 | $2,147 | $18,354 |
| 2023 | $2,497 | $19,525 | $2,200 | $17,325 |
| 2022 | $2,477 | $18,596 | $3,165 | $15,431 |
| 2021 | $2,390 | $17,710 | $3,014 | $14,696 |
| 2020 | $2,355 | $17,710 | $3,014 | $14,696 |
| 2019 | $2,747 | $19,957 | $3,014 | $16,943 |
| 2018 | $2,644 | $19,250 | $3,014 | $16,236 |
| 2017 | $2,659 | $19,250 | $3,014 | $16,236 |
| 2016 | $2,600 | $19,250 | $3,014 | $16,236 |
| 2015 | $2,629 | $19,250 | $3,014 | $16,236 |
| 2014 | $2,588 | $19,250 | $3,014 | $16,236 |
Source: Public Records
Map
Nearby Homes
- 7516 S 86th East Place
- 7409 S 84th East Ave
- 8202 E 74th Ct
- 8803 E 75th St
- 8507 E 78th St
- 7917 E 77th St
- 7948 S 86th East Place
- 7723 S 92nd East Ave
- 7327 E 75th St
- 7440 S 94th East Ave
- 7723 S 92nd East Place
- 8323 E 81st Place
- 8115 S 84th East Ave
- 7637 S 94th East Ave
- 8527 E 82nd St
- 9420 E 77th St
- 8303 S 84th East Place
- 9248 E 80th Place
- 6763 S 90th East Ave
- 8408 S 84th East Ave
- 7511 S 85th East Ave
- 7511 S 85th East Ave
- 7504 S 85th East Place
- 7519 S 85th East Ave
- 8507 E 75th St
- 8416 E 75th St
- 8513 E 75th St
- 7510 S 85th East Place
- 7510 S 85th East Ave
- 8519 E 75th St
- 8425 E 75th St
- 7516 S 85th East Ave
- 7516 S 85th East Place
- 7523 S 85th East Ave
- 7523 S 85th East Ave
- 8417 E 75th St
- 8525 E 75th St
- 7520 S 85th East Ave
- 8408 E 75th St
- 8530 E 75th St