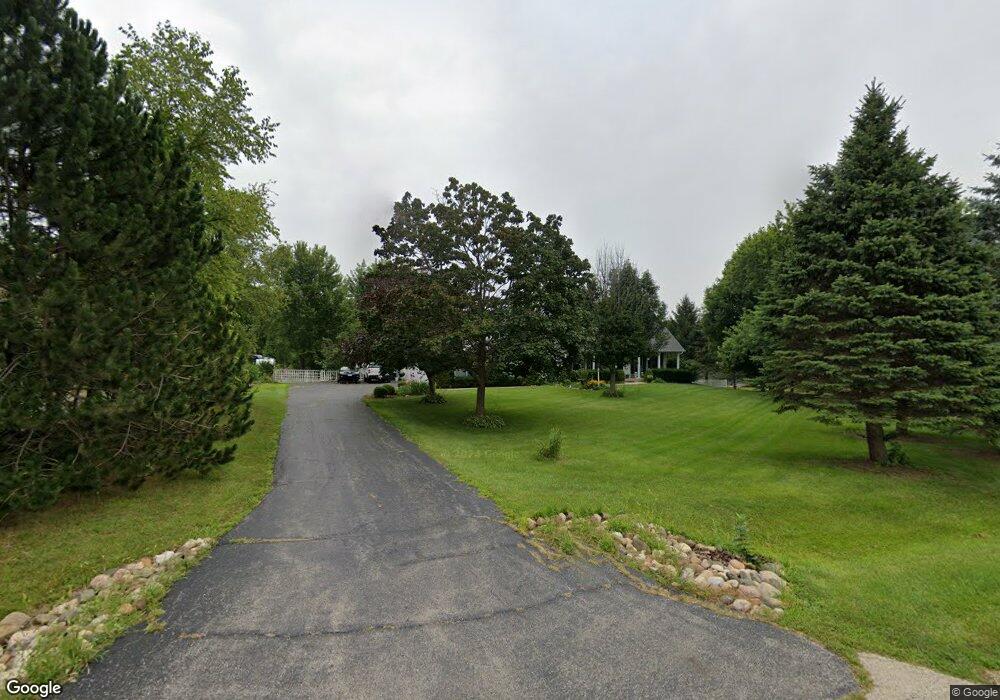
8508 S Hill Rd Marengo, IL 60152
Riley NeighborhoodEstimated Value: $470,893 - $592,000
--
Bed
--
Bath
2,279
Sq Ft
$223/Sq Ft
Est. Value
About This Home
This home is located at 8508 S Hill Rd, Marengo, IL 60152 and is currently estimated at $508,723, approximately $223 per square foot. 8508 S Hill Rd is a home located in McHenry County with nearby schools including Riley Community Consolidated School District 18, Marengo Community High School, and Zion Lutheran School.
Ownership History
Date
Name
Owned For
Owner Type
Purchase Details
Closed on
Oct 14, 2016
Sold by
Holle Marlene C
Bought by
Jackson Lawrence R and Jackson Sandra C
Current Estimated Value
Home Financials for this Owner
Home Financials are based on the most recent Mortgage that was taken out on this home.
Original Mortgage
$252,000
Outstanding Balance
$202,153
Interest Rate
3.48%
Mortgage Type
New Conventional
Estimated Equity
$306,570
Purchase Details
Closed on
Feb 18, 1999
Sold by
Holle William E and Holle Marlene C
Bought by
Holle William E and William E Holle Trust #1
Purchase Details
Closed on
Oct 29, 1997
Sold by
Holle William E and Holle Marlene C
Bought by
Holle William E and Holle Marlene C
Home Financials for this Owner
Home Financials are based on the most recent Mortgage that was taken out on this home.
Original Mortgage
$140,000
Interest Rate
6.62%
Mortgage Type
Construction
Purchase Details
Closed on
Aug 27, 1997
Sold by
Data Genevieve Nancy and Holicz Genevieve Nancy
Bought by
Holle William E and Holle Marlene C
Create a Home Valuation Report for This Property
The Home Valuation Report is an in-depth analysis detailing your home's value as well as a comparison with similar homes in the area
Home Values in the Area
Average Home Value in this Area
Purchase History
| Date | Buyer | Sale Price | Title Company |
|---|---|---|---|
| Jackson Lawrence R | $280,000 | First American Title | |
| Holle William E | -- | -- | |
| Holle William E | -- | Chicago Title | |
| Holle William E | $62,000 | Chicago Title |
Source: Public Records
Mortgage History
| Date | Status | Borrower | Loan Amount |
|---|---|---|---|
| Open | Jackson Lawrence R | $252,000 | |
| Previous Owner | Holle William E | $140,000 |
Source: Public Records
Tax History Compared to Growth
Tax History
| Year | Tax Paid | Tax Assessment Tax Assessment Total Assessment is a certain percentage of the fair market value that is determined by local assessors to be the total taxable value of land and additions on the property. | Land | Improvement |
|---|---|---|---|---|
| 2024 | $7,188 | $142,877 | $13,223 | $129,654 |
| 2023 | $8,792 | $127,319 | $11,783 | $115,536 |
| 2022 | $8,844 | $116,742 | $10,804 | $105,938 |
| 2021 | $6,293 | $108,164 | $10,010 | $98,154 |
| 2020 | $8,287 | $102,254 | $9,463 | $92,791 |
| 2019 | $8,830 | $97,869 | $9,057 | $88,812 |
| 2018 | $8,416 | $94,380 | $6,967 | $87,413 |
| 2017 | $8,267 | $91,233 | $6,735 | $84,498 |
| 2016 | $7,672 | $87,757 | $6,478 | $81,279 |
| 2013 | -- | $70,269 | $20,201 | $50,068 |
Source: Public Records
Map
Nearby Homes
- 8808 S Hill Rd
- 20510 Delks Dr
- 8106 Maple St
- 8116 Maple St
- 49.64 ACRES Beck Rd
- 18708 Beck Rd
- 7001 Maple St
- 1210 Maplewood Dr
- 1200 Maplewood Dr
- 0 Ratfield Rd
- 935 Courtney Ln
- 925 Courtney Ln
- 730 Cloverleaf Dr
- 720 Cloverleaf Dr
- Paxton Plan at Brookside Meadows
- 21303 Harmony Rd
- 0 S Grant Hwy
- 759 Bauman St Unit 7
- 735 Bauman St
- 704 Doral Dr Unit 2
- 8418 S Hill Rd
- 8516 S Hill Rd
- 8602 S Hill Rd
- 8414 S Hill Rd
- 8415 S Hill Rd
- 8513 S Hill Rd
- 8411 S Hill Rd
- 8515 S Hill Rd
- 8610 S Hill Rd
- 8400 S Hill Rd
- 8607 S Hill Rd
- 8614 S Hill Rd
- 8413 S Hill Rd
- 8613 S Hill Rd
- 22 Hill Rd
- 0 N Hill Rd Unit 7395277
- 8617 S Hill Rd
- 20302 Demings Dr
- 8702 S Hill Rd
- 8701 S Hill Rd