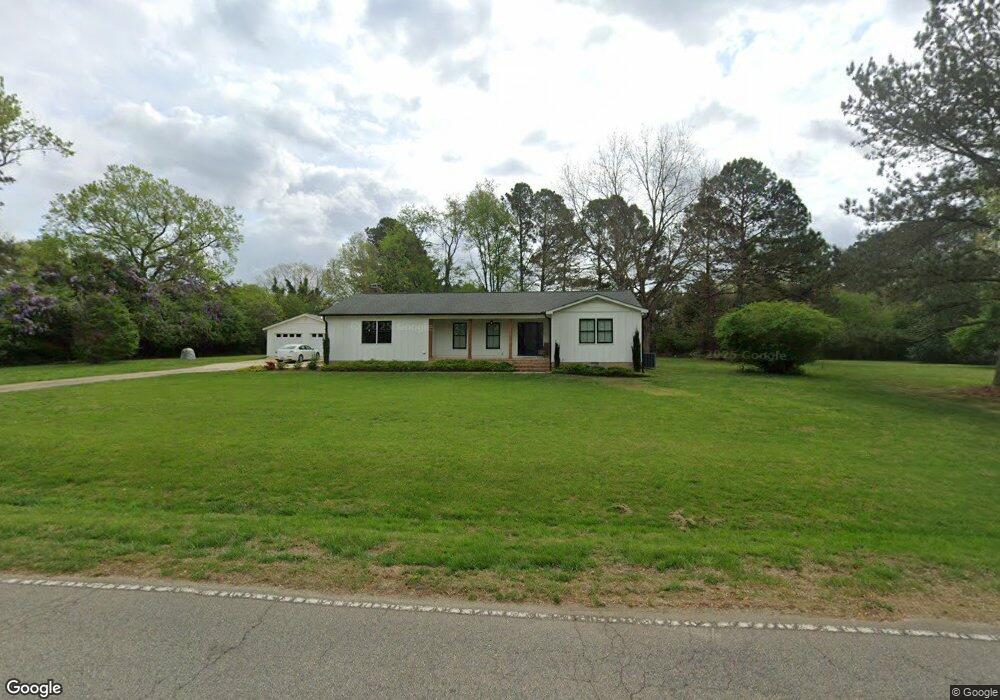
8509 Manns Loop Rd Apex, NC 27539
Middle Creek NeighborhoodEstimated Value: $364,000 - $399,000
3
Beds
2
Baths
1,600
Sq Ft
$238/Sq Ft
Est. Value
About This Home
This home is located at 8509 Manns Loop Rd, Apex, NC 27539 and is currently estimated at $380,420, approximately $237 per square foot. 8509 Manns Loop Rd is a home located in Wake County with nearby schools including West Lake Elementary School, West Lake Middle, and Middle Creek High.
Ownership History
Date
Name
Owned For
Owner Type
Purchase Details
Closed on
Nov 27, 2018
Sold by
Lepper John Charles and Lepper Debra Kallye
Bought by
Scoggins Richard Thomas and Scoggins Jennifer Young
Current Estimated Value
Home Financials for this Owner
Home Financials are based on the most recent Mortgage that was taken out on this home.
Original Mortgage
$200,850
Outstanding Balance
$177,201
Interest Rate
4.87%
Mortgage Type
Adjustable Rate Mortgage/ARM
Estimated Equity
$203,219
Purchase Details
Closed on
May 15, 2018
Sold by
Oneal Earl and Oneal Angela Todd
Bought by
Lepper John Charles and Lepper Debra Kellye
Purchase Details
Closed on
Apr 11, 2018
Sold by
Jordan Cordell J
Bought by
Oneal Timothy Earl and Oneal Angela Todd
Purchase Details
Closed on
Aug 14, 2017
Sold by
Jordan Suzette Lashay
Bought by
Jordan Cordell J
Purchase Details
Closed on
Jun 17, 1982
Bought by
Jordan Suzette Lashay Ellis
Create a Home Valuation Report for This Property
The Home Valuation Report is an in-depth analysis detailing your home's value as well as a comparison with similar homes in the area
Home Values in the Area
Average Home Value in this Area
Purchase History
| Date | Buyer | Sale Price | Title Company |
|---|---|---|---|
| Scoggins Richard Thomas | $201,000 | None Available | |
| Lepper John Charles | $190,000 | None Available | |
| Oneal Timothy Earl | $100,000 | None Available | |
| Jordan Cordell J | -- | None Available | |
| Jordan Suzette Lashay Ellis | $16,000 | -- |
Source: Public Records
Mortgage History
| Date | Status | Borrower | Loan Amount |
|---|---|---|---|
| Open | Scoggins Richard Thomas | $200,850 |
Source: Public Records
Tax History
| Year | Tax Paid | Tax Assessment Tax Assessment Total Assessment is a certain percentage of the fair market value that is determined by local assessors to be the total taxable value of land and additions on the property. | Land | Improvement |
|---|---|---|---|---|
| 2025 | $2,083 | $322,503 | $100,000 | $222,503 |
| 2024 | $2,023 | $322,503 | $100,000 | $222,503 |
Source: Public Records
Map
Nearby Homes
- 8224 Bells Lake Rd
- 8220 Bells Lake Rd
- 4004 Old Sturbridge Dr
- 8801 Valley Hill Ct
- 8313 Covington Hill Way
- 4412 Fairview Ridge Ln
- 5045 Homeplace Dr
- 273 Meadow Beauty Dr
- 4913 Mashpee Ln
- 5004 Rustler Ct
- 4912 Overeasy Dr
- 5012 Rustler Ct
- 5008 Rustler Ct
- 4908 Dr
- 5024 Overeasy Dr
- 0 Rhodes Rd Unit 10147590
- 212 Sea Biscuit Ln Unit 25
- 7243 Capulin Crest Dr
- 5032 Overeasy Dr
- 5033 Overeasy Dr
- 8521 Manns Loop Rd
- 3305 Optimist Farm Rd
- 3301 Optimist Farm Rd
- 8508 Manns Loop Rd
- 8500 Manns Loop Rd
- 8512 Manns Loop Rd
- 8525 Manns Loop Rd
- 8520 Manns Loop Rd
- 8516 Bells Lake Rd
- 4416 Twig Ct
- 8501 Bells Lake Rd
- 3304 Optimist Farm Rd
- 4604 Meadow Lake Dr
- 8524 Manns Loop Rd
- 8520 Bells Lake Rd
- 3312 Optimist Farm Rd
- 4609 Meadow Lake Dr
- 4412 Twig Ct
- 8445 Bells Lake Rd
- 8537 Manns Loop Rd
Your Personal Tour Guide
Ask me questions while you tour the home.