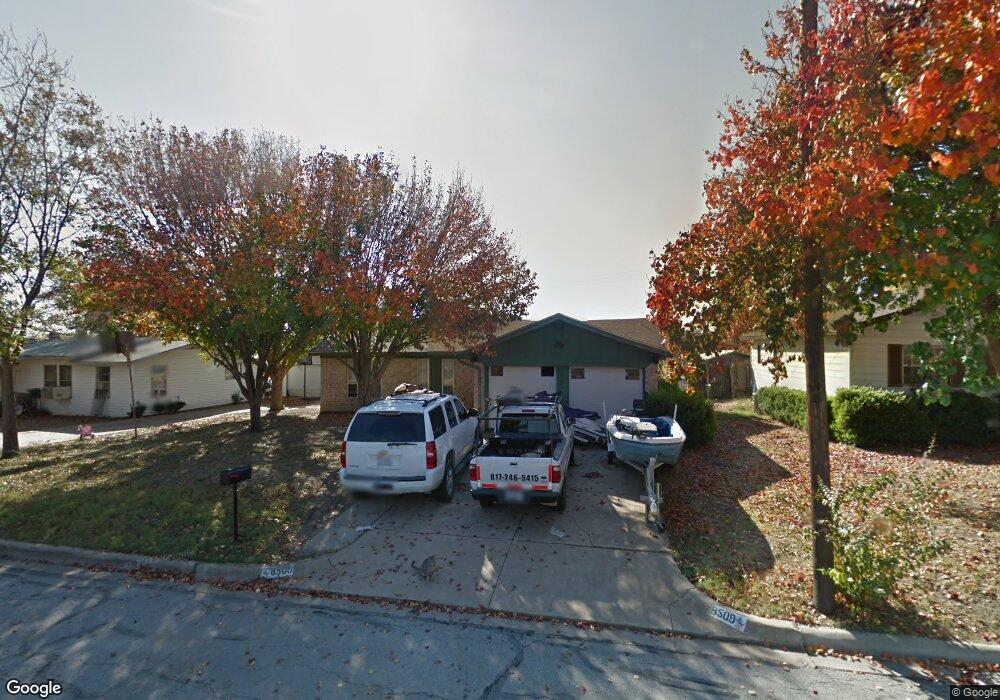
8509 Wilbur St Fort Worth, TX 76108
Estimated Value: $239,000 - $298,000
3
Beds
2
Baths
1,127
Sq Ft
$227/Sq Ft
Est. Value
About This Home
This home is located at 8509 Wilbur St, Fort Worth, TX 76108 and is currently estimated at $256,276, approximately $227 per square foot. 8509 Wilbur St is a home located in Tarrant County with nearby schools including North Elementary School, Brewer Middle School, and Tannahill Intermediate School.
Ownership History
Date
Name
Owned For
Owner Type
Purchase Details
Closed on
Jul 27, 2018
Sold by
Land Link Realty Llc
Bought by
Cash Robert Alton
Current Estimated Value
Home Financials for this Owner
Home Financials are based on the most recent Mortgage that was taken out on this home.
Original Mortgage
$147,250
Outstanding Balance
$128,160
Interest Rate
4.6%
Mortgage Type
New Conventional
Estimated Equity
$128,116
Purchase Details
Closed on
Feb 6, 2018
Sold by
Baugh Brett and Lambert Wendy
Bought by
Land Link Realty Llc
Purchase Details
Closed on
Sep 17, 2004
Sold by
Tate Roy A and Tate Mary Ann
Bought by
Scott Thomas W and Greer Amber
Home Financials for this Owner
Home Financials are based on the most recent Mortgage that was taken out on this home.
Original Mortgage
$69,451
Interest Rate
5.95%
Mortgage Type
FHA
Create a Home Valuation Report for This Property
The Home Valuation Report is an in-depth analysis detailing your home's value as well as a comparison with similar homes in the area
Home Values in the Area
Average Home Value in this Area
Purchase History
| Date | Buyer | Sale Price | Title Company |
|---|---|---|---|
| Cash Robert Alton | -- | Capital Title | |
| Land Link Realty Llc | -- | None Available | |
| Scott Thomas W | -- | Metroplex Title |
Source: Public Records
Mortgage History
| Date | Status | Borrower | Loan Amount |
|---|---|---|---|
| Open | Cash Robert Alton | $147,250 | |
| Previous Owner | Scott Thomas W | $69,451 |
Source: Public Records
Tax History Compared to Growth
Tax History
| Year | Tax Paid | Tax Assessment Tax Assessment Total Assessment is a certain percentage of the fair market value that is determined by local assessors to be the total taxable value of land and additions on the property. | Land | Improvement |
|---|---|---|---|---|
| 2025 | $3,360 | $245,368 | $47,020 | $198,348 |
| 2024 | $3,360 | $245,368 | $47,020 | $198,348 |
| 2023 | $4,578 | $246,357 | $47,020 | $199,337 |
| 2022 | $4,740 | $175,044 | $25,000 | $150,044 |
| 2021 | $4,634 | $175,044 | $25,000 | $150,044 |
| 2020 | $4,244 | $153,154 | $25,000 | $128,154 |
| 2019 | $4,406 | $153,154 | $25,000 | $128,154 |
| 2018 | $2,071 | $89,976 | $11,000 | $78,976 |
| 2017 | $2,390 | $102,273 | $11,000 | $91,273 |
| 2016 | $2,173 | $105,929 | $11,000 | $94,929 |
| 2015 | $1,617 | $67,600 | $11,000 | $56,600 |
| 2014 | $1,617 | $67,600 | $11,000 | $56,600 |
Source: Public Records
Map
Nearby Homes
- 8401 Clifford St
- 8814 Rockway St
- 627 Hallvale Dr
- 633 Lariat Ln
- 304 Lockwood St
- 308 Hallvale Dr
- 8814 Clifford St
- 311 Russell St
- 8133 Foxfire Ln
- 813 Hackamore St
- 8113 Foxfire Ln
- 8321 Raymond Ave
- 203 East Place
- 8811 Silver Creek Rd
- 9005 Glenn Dr
- 201 N Normandale St
- 105 Lockwood St
- 7945 White Settlement Rd
- 200 Waynell St
- 8417 Omaha Dr