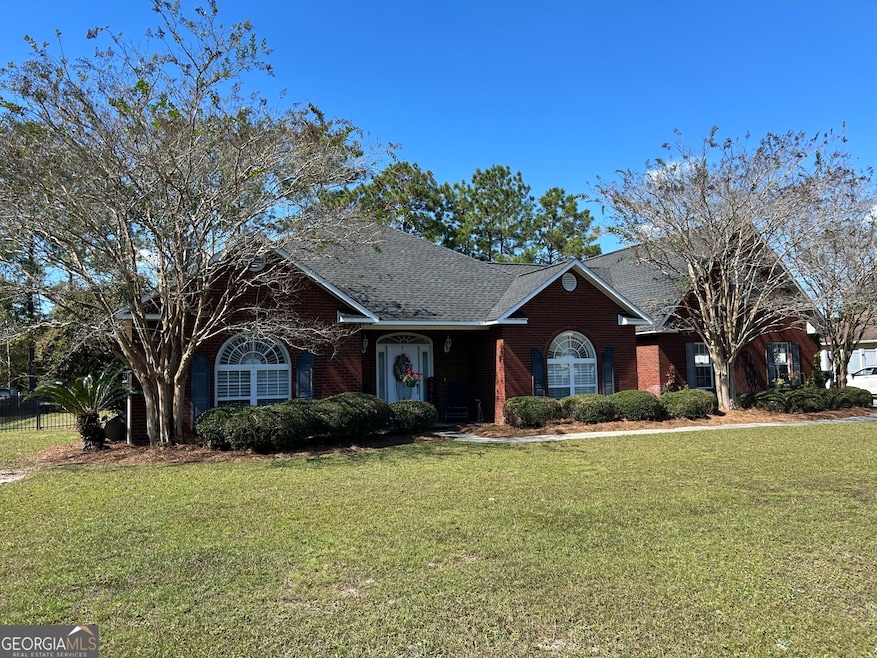
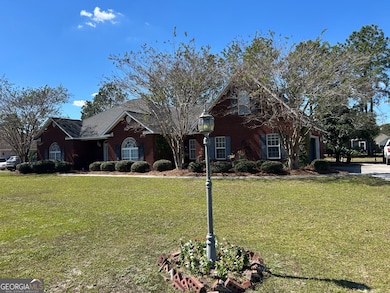
851 Carriage Ln Waycross, GA 31503
Estimated payment $2,449/month
Highlights
- Wood Flooring
- High Ceiling
- Breakfast Area or Nook
- Bonus Room
- No HOA
- Laundry Room
About This Home
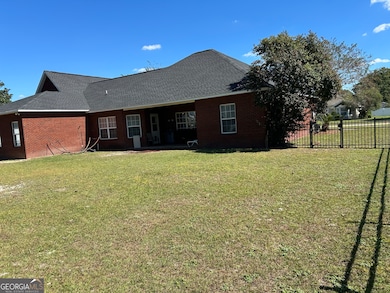
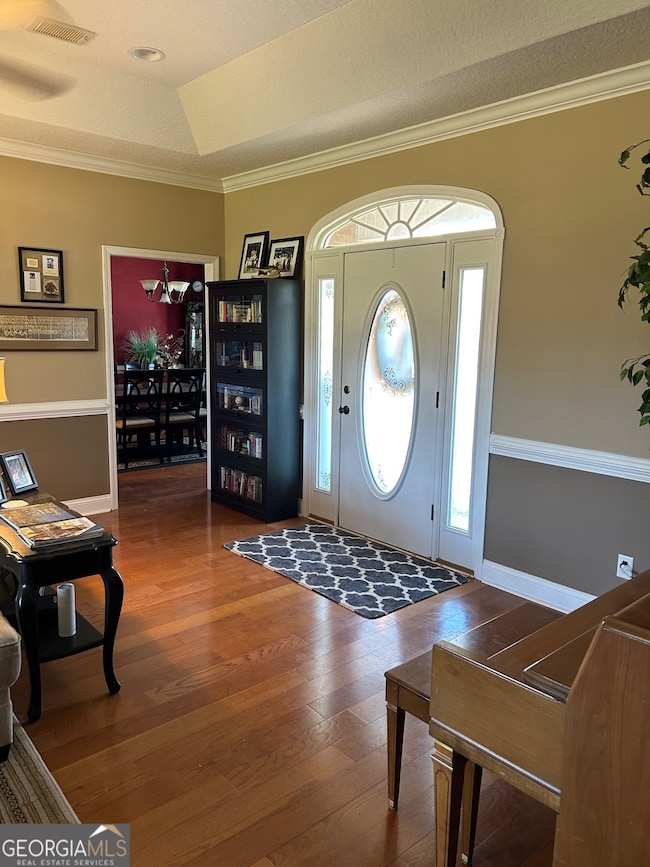
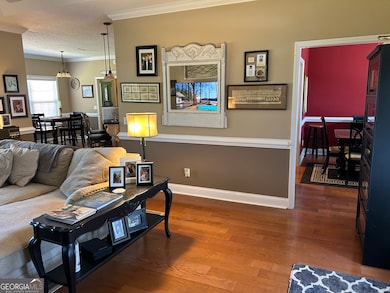
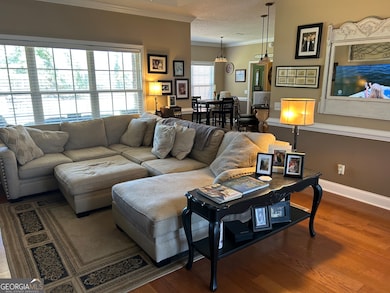
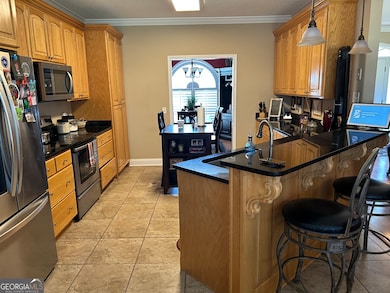
Welcome home to this stunning 4-bedroom, 2.5-bath brick beauty offering 2,418 sq. ft. of comfortable living space. Nestled in a peaceful, family-friendly neighborhood, this property blends classic charm with modern updates throughout. Step inside to find gleaming hardwood floors, an inviting open layout, and granite countertops that elevate the kitchen's appeal. The brand-new appliances make cooking a joy, while the spacious living areas are perfect for both relaxing and entertaining. The primary suite provides a private retreat with a full bath and ample closet space. Three additional bedrooms offer plenty of room for family, guests, or a home office. One of the additional bedrooms is located upstairs and offers a large amount of space (312 sf). Enjoy peace of mind with a new roof and a 2-year-old A/C unit-meaning years of worry-free comfort ahead. Outside, you'll love the fenced-in backyard, ideal for pets, play, and outdoor gatherings. The two-car garage provides convenience and extra storage.
Home Details
Home Type
- Single Family
Est. Annual Taxes
- $4,145
Year Built
- Built in 2004 | Remodeled
Lot Details
- 0.45 Acre Lot
- Fenced
- Level Lot
Parking
- Side or Rear Entrance to Parking
Home Design
- Four Sided Brick Exterior Elevation
Interior Spaces
- 2,418 Sq Ft Home
- 2-Story Property
- High Ceiling
- Ceiling Fan
- Bonus Room
- Laundry Room
Kitchen
- Breakfast Area or Nook
- Breakfast Bar
- Oven or Range
- Cooktop
- Microwave
- Ice Maker
- Dishwasher
Flooring
- Wood
- Carpet
- Tile
Bedrooms and Bathrooms
Schools
- Memorial Drive Elementary School
- Waycross Middle School
- Ware County High School
Utilities
- Central Heating and Cooling System
- Private Water Source
- Electric Water Heater
- Phone Available
- Cable TV Available
Community Details
- No Home Owners Association
- Central Estates Subdivision
Map
Home Values in the Area
Average Home Value in this Area
Tax History
| Year | Tax Paid | Tax Assessment Tax Assessment Total Assessment is a certain percentage of the fair market value that is determined by local assessors to be the total taxable value of land and additions on the property. | Land | Improvement |
|---|---|---|---|---|
| 2024 | $2,630 | $149,343 | $12,000 | $137,343 |
| 2023 | $2,682 | $125,360 | $11,500 | $113,860 |
| 2022 | $2,998 | $125,360 | $11,500 | $113,860 |
| 2021 | $3,206 | $117,156 | $11,500 | $105,656 |
| 2020 | $3,128 | $100,648 | $11,500 | $89,148 |
| 2019 | $2,976 | $94,044 | $11,500 | $82,544 |
| 2018 | $2,926 | $91,643 | $11,500 | $80,143 |
| 2017 | $2,923 | $91,643 | $11,500 | $80,143 |
| 2016 | $2,923 | $91,643 | $11,500 | $80,143 |
| 2015 | $3,156 | $97,885 | $14,000 | $83,886 |
| 2014 | $3,151 | $97,886 | $14,000 | $83,886 |
| 2013 | -- | $97,885 | $14,000 | $83,885 |
Property History
| Date | Event | Price | List to Sale | Price per Sq Ft |
|---|---|---|---|---|
| 10/27/2025 10/27/25 | For Sale | $399,900 | -- | $165 / Sq Ft |
Purchase History
| Date | Type | Sale Price | Title Company |
|---|---|---|---|
| Warranty Deed | -- | -- | |
| Interfamily Deed Transfer | $195,000 | -- | |
| Deed | $179,000 | -- | |
| Deed | $25,000 | -- |
Mortgage History
| Date | Status | Loan Amount | Loan Type |
|---|---|---|---|
| Open | $194,596 | FHA | |
| Previous Owner | $155,000 | New Conventional |
Source: Georgia MLS
MLS Number: 10633244
APN: 054M04-015
Disclaimer: Certain information contained herein is derived from information provided by parties other than Homes.com. All information provided is deemed reliable, but is not guaranteed to be accurate and should be independently verified.
![]() The data relating to real estate for sale on this web site comes in part from the Broker Reciprocity Program of Georgia MLS. Real estate listings held by brokerage firms other than Redfin are marked with the Broker Reciprocity logo and detailed information about them includes the name of the listing brokers. Information deemed reliable but not guaranteed. Copyright 2025 Georgia MLS. All rights reserved.
The data relating to real estate for sale on this web site comes in part from the Broker Reciprocity Program of Georgia MLS. Real estate listings held by brokerage firms other than Redfin are marked with the Broker Reciprocity logo and detailed information about them includes the name of the listing brokers. Information deemed reliable but not guaranteed. Copyright 2025 Georgia MLS. All rights reserved.
- 627 Saddle Cir
- 664 Saddle Cir
- 630 Saddle Cir
- 606 Stonewall Jackson Place
- 3817 Central Ave
- 4155 Pinecrest Rd
- Tract 4 County-Line Rd S
- 1132 Hilltop Rd
- 4337 White Hall Church Rd
- 4337 Whitehall Church Rd
- 3153 Southwood Dr
- 3070 Central Ave
- 763 Kentland Dr
- 867 Kentland Dr
- 4408 Brunswick Hwy
- 2775 Seminole Trail
- 6498 Central Ave
- 120 Scarlett Dr
- 723 St Bernard Trail
- 1049 Riverdale Dr
