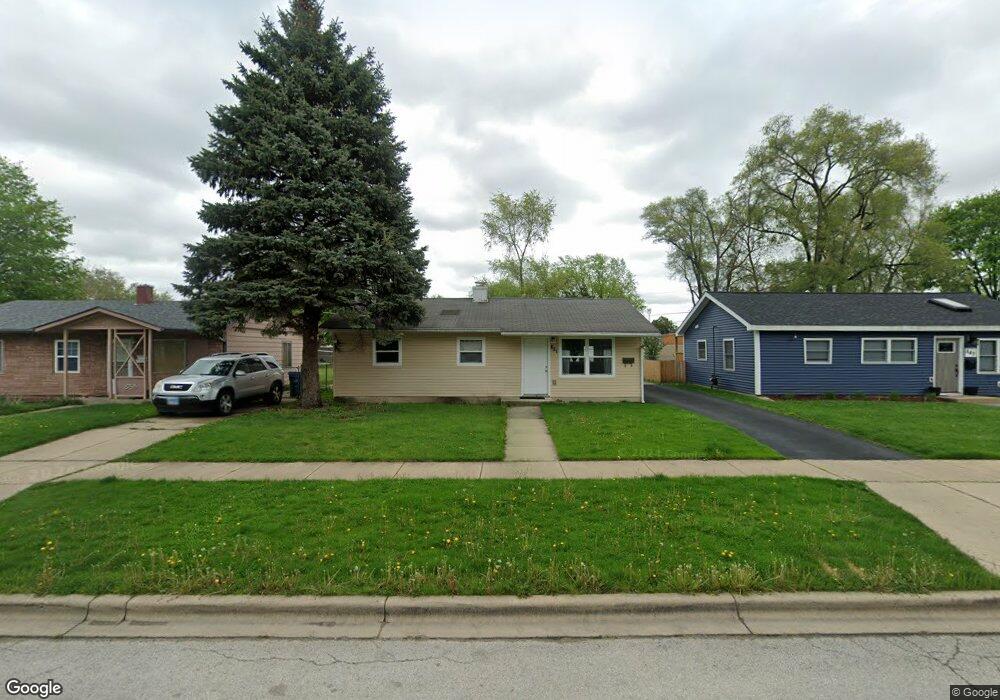
851 Foran Ln Aurora, IL 60506
North River NeighborhoodEstimated Value: $198,000 - $266,000
2
Beds
1
Bath
864
Sq Ft
$271/Sq Ft
Est. Value
About This Home
This home is located at 851 Foran Ln, Aurora, IL 60506 and is currently estimated at $234,022, approximately $270 per square foot. 851 Foran Ln is a home located in Kane County with nearby schools including Mccleery Elementary School, Jefferson Middle School, and West Aurora High School.
Ownership History
Date
Name
Owned For
Owner Type
Purchase Details
Closed on
Feb 9, 2022
Sold by
Memetresat Rejani
Bought by
Rejani Memetresat and Rejani Xhemadije
Current Estimated Value
Purchase Details
Closed on
Apr 1, 2009
Sold by
Bank Of New York Trust Company
Bought by
Rejani Memetresat
Home Financials for this Owner
Home Financials are based on the most recent Mortgage that was taken out on this home.
Original Mortgage
$56,000
Interest Rate
4.85%
Mortgage Type
Purchase Money Mortgage
Purchase Details
Closed on
Sep 4, 2008
Sold by
Arendt James P
Bought by
Bank Of New York Trust Company
Purchase Details
Closed on
Jan 18, 2002
Sold by
Behrens William L and Behrens Carolyn J
Bought by
Arendt James P
Home Financials for this Owner
Home Financials are based on the most recent Mortgage that was taken out on this home.
Original Mortgage
$104,545
Interest Rate
7.16%
Mortgage Type
FHA
Create a Home Valuation Report for This Property
The Home Valuation Report is an in-depth analysis detailing your home's value as well as a comparison with similar homes in the area
Home Values in the Area
Average Home Value in this Area
Purchase History
| Date | Buyer | Sale Price | Title Company |
|---|---|---|---|
| Rejani Memetresat | -- | Law Offices Of Jay R Wyeth Pc | |
| Rejani Memetresat | $70,000 | Premier Title Company | |
| Bank Of New York Trust Company | -- | Premier Title | |
| Arendt James P | $105,500 | Ticor Title Insurance Compan |
Source: Public Records
Mortgage History
| Date | Status | Borrower | Loan Amount |
|---|---|---|---|
| Previous Owner | Rejani Memetresat | $56,000 | |
| Previous Owner | Arendt James P | $104,545 |
Source: Public Records
Tax History
| Year | Tax Paid | Tax Assessment Tax Assessment Total Assessment is a certain percentage of the fair market value that is determined by local assessors to be the total taxable value of land and additions on the property. | Land | Improvement |
|---|---|---|---|---|
| 2024 | $5,011 | $62,249 | $8,327 | $53,922 |
| 2023 | $4,843 | $55,619 | $7,440 | $48,179 |
| 2022 | $4,570 | $50,747 | $6,788 | $43,959 |
| 2021 | $4,179 | $44,878 | $6,320 | $38,558 |
| 2020 | $3,979 | $41,685 | $5,870 | $35,815 |
| 2019 | $3,856 | $38,623 | $5,439 | $33,184 |
| 2018 | $3,535 | $34,642 | $5,031 | $29,611 |
| 2017 | $3,174 | $30,099 | $4,636 | $25,463 |
| 2016 | $2,204 | $26,184 | $3,974 | $22,210 |
| 2015 | -- | $26,222 | $3,417 | $22,805 |
| 2014 | -- | $23,387 | $3,140 | $20,247 |
| 2013 | -- | $23,885 | $3,095 | $20,790 |
Source: Public Records
Map
Nearby Homes
- 847 Foran Ln
- 833 Sheldon Ave
- 732 N Fordham Ave
- 1039 S Pleasure Ct
- 1061 S Pleasure Ct
- 424 N Lancaster Ave
- 1387 S Glen Cir Unit D
- 833 N Randall Rd Unit C4
- 603 N May St
- 418 W Illinois Ave
- 519 N View St
- 930 W New York St Unit 932
- 507 W Park Ave
- 810 W Galena Blvd
- 1080 Scarlet Oak Cir
- 415 Blackhawk St
- 932 W New York St
- 659 W Downer Place
- 338 Lakelawn Blvd
- 371 Cedar St
Your Personal Tour Guide
Ask me questions while you tour the home.