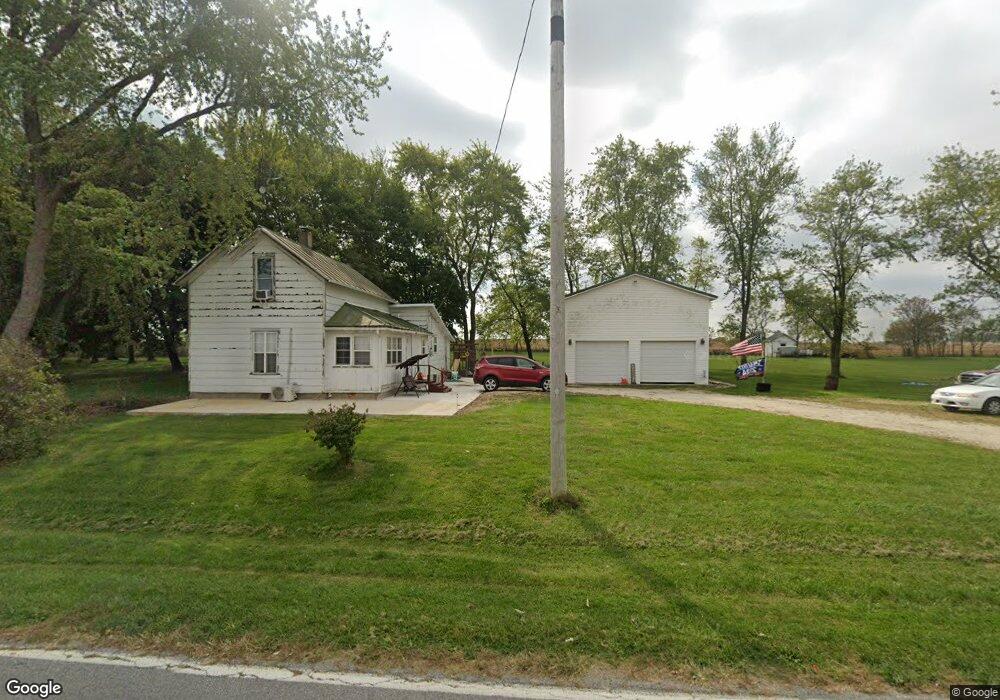
851 Peters Rd Fort Recovery, OH 45846
Estimated Value: $140,076 - $236,000
3
Beds
1
Bath
1,448
Sq Ft
$120/Sq Ft
Est. Value
About This Home
This home is located at 851 Peters Rd, Fort Recovery, OH 45846 and is currently estimated at $174,019, approximately $120 per square foot. 851 Peters Rd is a home with nearby schools including Fort Recovery Elementary School, Fort Recovery Middle School, and Fort Recovery High School.
Ownership History
Date
Name
Owned For
Owner Type
Purchase Details
Closed on
May 12, 2017
Sold by
Langenkamp Daniel E
Bought by
Sutter Charles E and Dakin Melissa L
Current Estimated Value
Home Financials for this Owner
Home Financials are based on the most recent Mortgage that was taken out on this home.
Original Mortgage
$63,700
Outstanding Balance
$53,362
Interest Rate
4.37%
Mortgage Type
Adjustable Rate Mortgage/ARM
Estimated Equity
$120,657
Purchase Details
Closed on
Jul 3, 2013
Sold by
Langenkamp Chong S and Sides Chong S
Bought by
Langenkamp Daniel E
Purchase Details
Closed on
Jan 15, 2010
Sold by
Arnett Gary and Arnett Edith E
Bought by
Langenkamp Daniel E and Sides Chong S
Home Financials for this Owner
Home Financials are based on the most recent Mortgage that was taken out on this home.
Original Mortgage
$54,400
Interest Rate
4.87%
Mortgage Type
New Conventional
Purchase Details
Closed on
Mar 24, 2005
Sold by
Kreider Perry E
Bought by
Arnett Gary
Create a Home Valuation Report for This Property
The Home Valuation Report is an in-depth analysis detailing your home's value as well as a comparison with similar homes in the area
Home Values in the Area
Average Home Value in this Area
Purchase History
| Date | Buyer | Sale Price | Title Company |
|---|---|---|---|
| Sutter Charles E | $69,000 | Attorney | |
| Langenkamp Daniel E | -- | Attorney | |
| Langenkamp Daniel E | $68,000 | Attorney | |
| Arnett Gary | $22,000 | -- |
Source: Public Records
Mortgage History
| Date | Status | Borrower | Loan Amount |
|---|---|---|---|
| Open | Sutter Charles E | $63,700 | |
| Previous Owner | Langenkamp Daniel E | $54,400 |
Source: Public Records
Tax History Compared to Growth
Tax History
| Year | Tax Paid | Tax Assessment Tax Assessment Total Assessment is a certain percentage of the fair market value that is determined by local assessors to be the total taxable value of land and additions on the property. | Land | Improvement |
|---|---|---|---|---|
| 2024 | $921 | $34,790 | $12,070 | $22,720 |
| 2023 | $941 | $35,330 | $12,610 | $22,720 |
| 2022 | $883 | $30,790 | $10,940 | $19,850 |
| 2021 | $887 | $30,790 | $10,940 | $19,850 |
| 2020 | $889 | $30,790 | $10,940 | $19,850 |
| 2019 | $790 | $26,820 | $10,940 | $15,880 |
| 2018 | $833 | $26,820 | $10,940 | $15,880 |
| 2017 | $748 | $26,820 | $10,940 | $15,880 |
| 2016 | $797 | $24,690 | $9,440 | $15,250 |
| 2015 | $724 | $24,690 | $9,440 | $15,250 |
| 2014 | $738 | $24,690 | $9,440 | $15,250 |
| 2013 | $615 | $19,690 | $9,160 | $10,530 |
Source: Public Records
Map
Nearby Homes
- 201 W Wiggs St
- 304 S Wayne St
- 3709 Rossburg-Lightsville Rd
- 4475 Ohio 705
- 0 County Road 400 N
- 1200 N Jackson Pike
- 509 Indiana 28
- 0 W Deerfield Rd Unit 23016117
- 0 W Deerfield Rd Unit 837795
- 0 W Deerfield Rd
- 3052 State Route 47
- 811 N Columbia St
- 811 N Columbia St
- 543 N Walnut St
- 718 Lynwood Ct
- 706 Lynwood Ct
- 807 E Cherry St
- 722 N Union St
- 230 NW Deerfield Rd
- 612 N Howard St
- 869 Peters Rd
- 875 Peters Rd
- 821 Peters Rd
- 887 Peters Rd
- 897 Peters Rd
- 907 Peters Rd
- 917 Peters Rd
- 925 Peters Rd
- 935 Peters Rd
- 947 Peters Rd
- 14223 Fort Recovery Hillgrov Rd
- 946 Peters Rd
- 951 Peters Rd
- 793 Peters Rd
- 961 Peters Rd
- 969 Peters Rd
- 979 Peters Rd
- 987 Peters Rd
- 995 Peters Rd
- 14361 Fort Recovery Hillgrov Rd