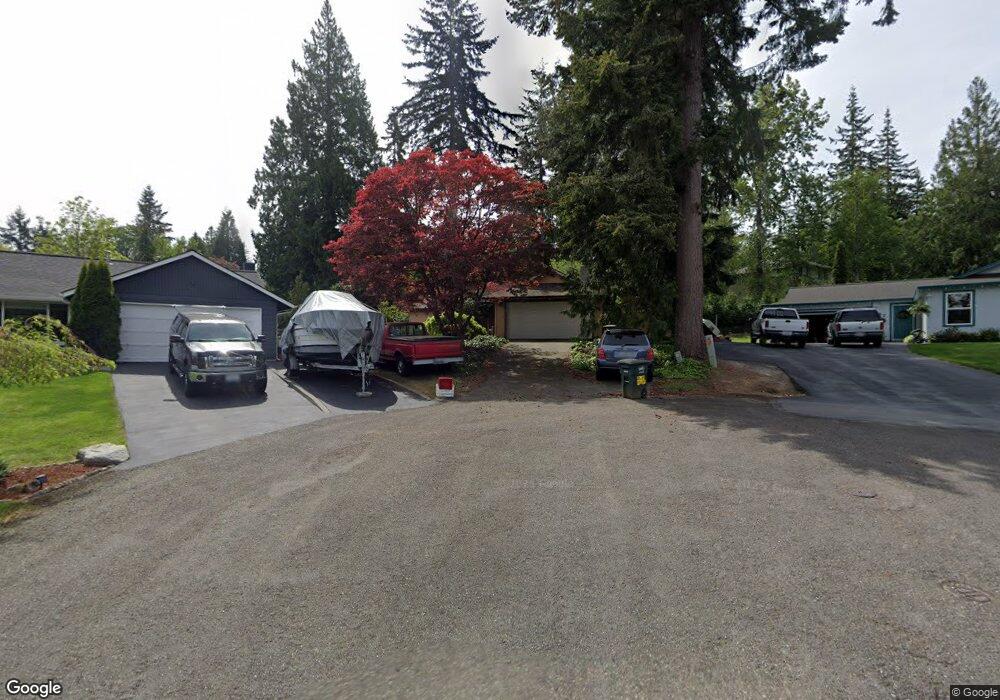
851 St Andrews Way Bellingham, WA 98229
Estimated Value: $556,090 - $634,000
2
Beds
2
Baths
1,040
Sq Ft
$561/Sq Ft
Est. Value
About This Home
This home is located at 851 St Andrews Way, Bellingham, WA 98229 and is currently estimated at $583,023, approximately $560 per square foot. 851 St Andrews Way is a home located in Whatcom County with nearby schools including Wade King Elementary School, Fairhaven Middle School, and Sehome High School.
Create a Home Valuation Report for This Property
The Home Valuation Report is an in-depth analysis detailing your home's value as well as a comparison with similar homes in the area
Home Values in the Area
Average Home Value in this Area
Tax History Compared to Growth
Tax History
| Year | Tax Paid | Tax Assessment Tax Assessment Total Assessment is a certain percentage of the fair market value that is determined by local assessors to be the total taxable value of land and additions on the property. | Land | Improvement |
|---|---|---|---|---|
| 2024 | $3,947 | $454,810 | $244,963 | $209,847 |
| 2023 | $3,947 | $471,071 | $253,721 | $217,350 |
| 2022 | $3,399 | $400,913 | $215,934 | $184,979 |
| 2021 | $3,029 | $323,326 | $174,145 | $149,181 |
| 2020 | $2,965 | $283,617 | $152,758 | $130,859 |
| 2019 | $2,660 | $269,214 | $145,000 | $124,214 |
| 2018 | $2,772 | $242,406 | $98,735 | $143,671 |
| 2017 | $2,448 | $215,169 | $87,640 | $127,529 |
| 2016 | $2,217 | $198,144 | $80,640 | $117,504 |
| 2015 | $2,176 | $187,928 | $76,440 | $111,488 |
| 2014 | -- | $178,974 | $72,800 | $106,174 |
| 2013 | -- | $170,259 | $70,000 | $100,259 |
Source: Public Records
Map
Nearby Homes
- 842 Woodbine Way
- 2496 Yew Street Rd
- 0 Princeton Ct
- 2284 Yew Street Rd Unit B6
- 2284 Yew Street Rd Unit D3
- 905 Queen St
- 0 Lopez St
- 143 S 44th St
- 1146 Whidbey St
- 1101 Whidbey St
- 115 43rd St
- 4224 Dumas Ave
- 2501 Fireweed Ln
- 1401 Edwards St
- 1125 Divine Ln
- 1110 Divine Ln
- 4007 Adams Ave
- 1211 Kenoyer Dr
- 1227 Puget St
- 921 Whitewater Dr
- 855 St Andrews Way
- 847 St Andrews Way
- 867 St Andrews Way
- 2485 Autumnwood Ct
- 871 St Andrews Way
- 859 St Andrews Way
- 843 St Andrews Way
- 2497 Autumnwood Ct
- 2483 Autumnwood Ct
- 863 St Andrews Way
- 2487 Autumnwood Ct
- 875 St Andrews Way
- 2495 Autumnwood Ct
- 837 St Andrews Way
- 2504 Bloor St
- 2481 Autumnwood Ct
- 2508 Bloor St
- 856 St Andrews Way
- 860 St Andrews Way
- 852 St Andrews Way