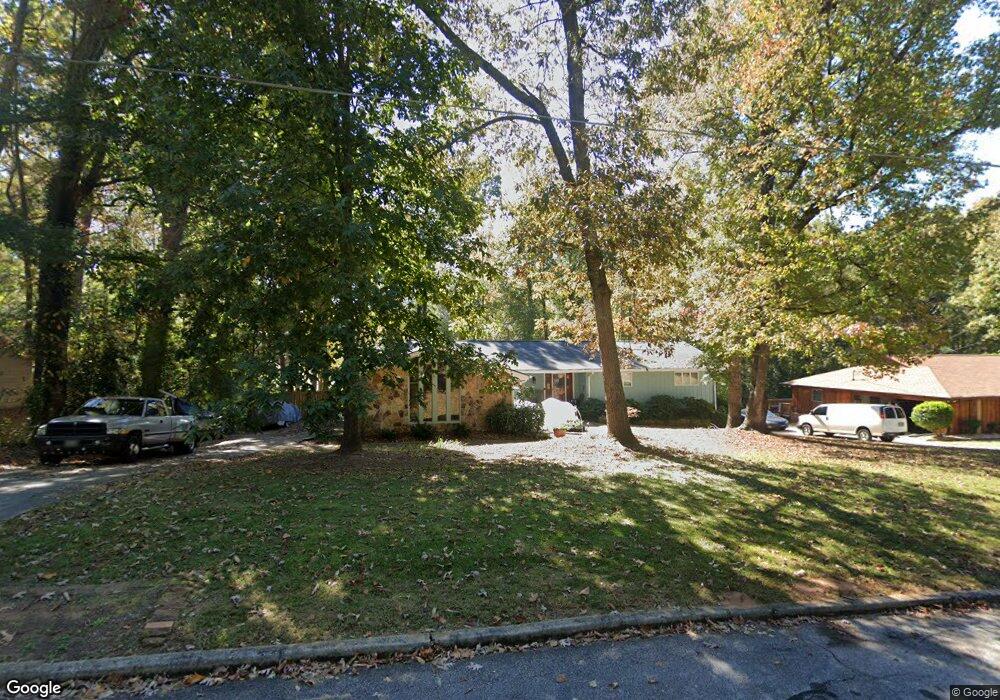
851 Sweet Briar Ln SE Unit 8 Conyers, GA 30094
Estimated Value: $323,143 - $346,000
3
Beds
3
Baths
1,963
Sq Ft
$168/Sq Ft
Est. Value
About This Home
This home is located at 851 Sweet Briar Ln SE Unit 8, Conyers, GA 30094 and is currently estimated at $330,536, approximately $168 per square foot. 851 Sweet Briar Ln SE Unit 8 is a home located in Rockdale County with nearby schools including Honey Creek Elementary School, Edwards Middle School, and Heritage High School.
Ownership History
Date
Name
Owned For
Owner Type
Purchase Details
Closed on
May 29, 2001
Sold by
Geter Rick D and Geter Estelle W
Bought by
Fox Thomas M and Fox Nanci J
Current Estimated Value
Home Financials for this Owner
Home Financials are based on the most recent Mortgage that was taken out on this home.
Original Mortgage
$143,920
Outstanding Balance
$66,035
Interest Rate
9.99%
Mortgage Type
New Conventional
Estimated Equity
$264,501
Purchase Details
Closed on
Aug 31, 1995
Sold by
Hoyt David Carolyn
Bought by
Elliott Craig Tammy
Purchase Details
Closed on
Feb 11, 1994
Sold by
Gilliam Jeffrey S and Gilliam Janet H
Bought by
Geter Rick D and Geter Estelle W
Home Financials for this Owner
Home Financials are based on the most recent Mortgage that was taken out on this home.
Original Mortgage
$110,000
Interest Rate
7.17%
Create a Home Valuation Report for This Property
The Home Valuation Report is an in-depth analysis detailing your home's value as well as a comparison with similar homes in the area
Home Values in the Area
Average Home Value in this Area
Purchase History
| Date | Buyer | Sale Price | Title Company |
|---|---|---|---|
| Fox Thomas M | $179,900 | -- | |
| Elliott Craig Tammy | $121,500 | -- | |
| Geter Rick D | $138,800 | -- |
Source: Public Records
Mortgage History
| Date | Status | Borrower | Loan Amount |
|---|---|---|---|
| Open | Fox Thomas M | $143,920 | |
| Previous Owner | Geter Rick D | $110,000 | |
| Closed | Elliott Craig Tammy | $0 |
Source: Public Records
Tax History Compared to Growth
Tax History
| Year | Tax Paid | Tax Assessment Tax Assessment Total Assessment is a certain percentage of the fair market value that is determined by local assessors to be the total taxable value of land and additions on the property. | Land | Improvement |
|---|---|---|---|---|
| 2024 | $3,111 | $127,120 | $24,640 | $102,480 |
| 2023 | $2,737 | $116,480 | $14,000 | $102,480 |
| 2022 | $2,332 | $100,720 | $21,640 | $79,080 |
| 2021 | $2,083 | $85,840 | $15,320 | $70,520 |
| 2020 | $1,962 | $79,800 | $15,000 | $64,800 |
| 2019 | $1,738 | $70,960 | $9,960 | $61,000 |
| 2018 | $1,592 | $65,880 | $9,360 | $56,520 |
| 2017 | $2,928 | $63,960 | $9,720 | $54,240 |
| 2016 | $2,615 | $57,080 | $9,720 | $47,360 |
| 2015 | $2,558 | $55,760 | $8,400 | $47,360 |
| 2014 | $2,571 | $55,476 | $7,920 | $47,556 |
| 2013 | -- | $64,076 | $12,000 | $52,076 |
Source: Public Records
Map
Nearby Homes
- 864 Sweet Briar Ln SE
- 760 Sugar Hill Ln SE
- 756 Sugar Hill Ln SE
- 3514 Blackberry Ln SE
- 780 Sweet Briar Trail SE
- 781 Sweet Briar Trail SE
- 3665 Clubhouse Ln SE
- 920 Sugar Creek Dr SE
- 958 Sweet Briar Trail SE
- 3550 Clubhouse Ln SE
- 3488 Richmond Dr SE
- 3446 Richmond Dr SE
- 650 Honey Creek Rd SE
- 649 Sugar Creek Trail SE
- 853 Waterside Dr SE
- 3362 Stanton Rd SE
- 1001 Fox St SE
- 861 Sweet Briar Ln SE Unit 735
- 861 Sweet Briar Ln SE
- 841 Sweet Briar Ln SE
- 3712 Sweet Briar Ct SE Unit 6
- 3711 Sweet Briar Ct SE Unit 6
- 867 Sweet Briar Ln SE
- 858 Sweet Briar Ln SE Unit VIII
- 846 Sweet Briar Ln SE Unit 8
- 0 Sweet Briar Ln SE Unit 7515218
- 0 Sweet Briar Ln SE Unit 7423188
- 0 Sweet Briar Ln SE Unit 8393402
- 0 Sweet Briar Ln SE Unit 8309704
- 0 Sweet Briar Ln SE Unit 7587995
- 0 Sweet Briar Ln SE Unit 7585005
- 0 Sweet Briar Ln SE Unit 7547780
- 0 Sweet Briar Ln SE Unit 8883210
- 0 Sweet Briar Ln SE Unit 7151620
- 3714 Sweet Briar Ct SE
- 832 Sweet Briar Ln SE
- 875 Sweet Briar Ln SE