Estimated Value: $303,000 - $376,000
3
Beds
2
Baths
2,454
Sq Ft
$136/Sq Ft
Est. Value
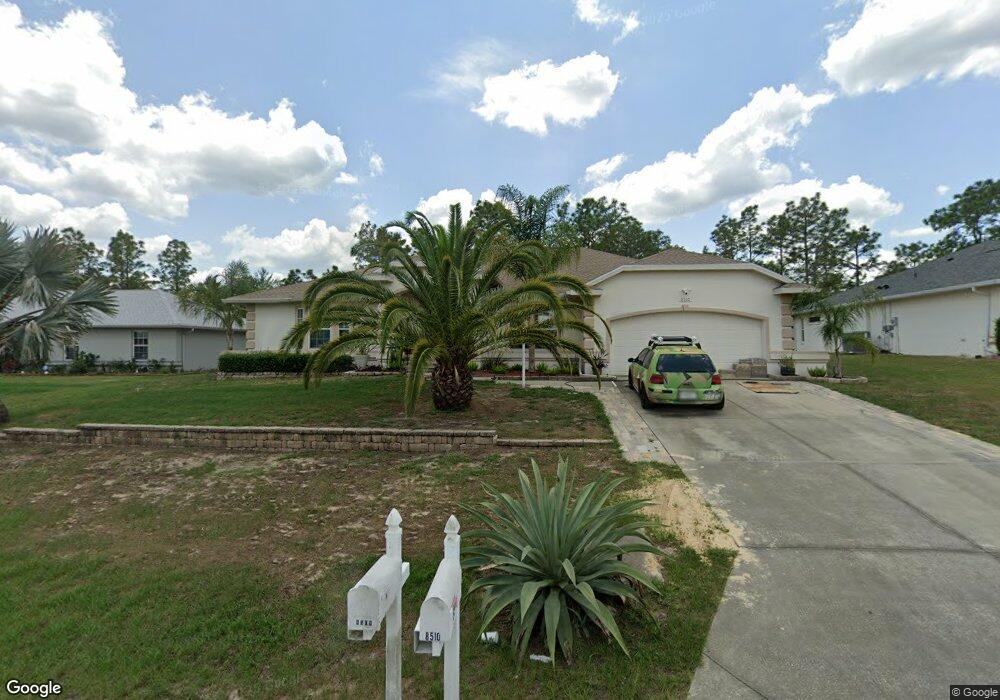
About This Home
This home is located at 8510 SW 136th Loop, Ocala, FL 34473 and is currently estimated at $333,117, approximately $135 per square foot. 8510 SW 136th Loop is a home located in Marion County with nearby schools including Marion Oaks Elementary School, Horizon Academy At Marion Oaks, and Dunnellon High School.
Ownership History
Date
Name
Owned For
Owner Type
Purchase Details
Closed on
Feb 24, 2025
Sold by
Good Daria S
Bought by
Good Daria S and Birmingham Eric Thomas
Current Estimated Value
Purchase Details
Closed on
Oct 22, 2011
Sold by
Birmingham Marcus J
Bought by
Good Daria S
Purchase Details
Closed on
Feb 8, 2010
Sold by
Wells Fargo Bank N A
Bought by
Birmingham Marcus
Home Financials for this Owner
Home Financials are based on the most recent Mortgage that was taken out on this home.
Original Mortgage
$96,062
Interest Rate
5.25%
Mortgage Type
FHA
Purchase Details
Closed on
Jan 5, 2010
Sold by
Polycarpe Frantz and Cerene Mirlande
Bought by
Wells Fargo Bank Na
Home Financials for this Owner
Home Financials are based on the most recent Mortgage that was taken out on this home.
Original Mortgage
$96,062
Interest Rate
5.25%
Mortgage Type
FHA
Create a Home Valuation Report for This Property
The Home Valuation Report is an in-depth analysis detailing your home's value as well as a comparison with similar homes in the area
Home Values in the Area
Average Home Value in this Area
Purchase History
| Date | Buyer | Sale Price | Title Company |
|---|---|---|---|
| Good Daria S | $100 | None Listed On Document | |
| Good Daria S | $100 | None Listed On Document | |
| Good Daria S | -- | None Available | |
| Birmingham Marcus | $104,900 | Florida Premier Title & Escr | |
| Wells Fargo Bank Na | -- | None Available |
Source: Public Records
Mortgage History
| Date | Status | Borrower | Loan Amount |
|---|---|---|---|
| Previous Owner | Birmingham Marcus | $96,062 |
Source: Public Records
Tax History
| Year | Tax Paid | Tax Assessment Tax Assessment Total Assessment is a certain percentage of the fair market value that is determined by local assessors to be the total taxable value of land and additions on the property. | Land | Improvement |
|---|---|---|---|---|
| 2025 | $5,951 | $313,089 | -- | -- |
| 2024 | $5,452 | $284,626 | -- | -- |
| 2023 | $5,452 | $258,751 | -- | -- |
| 2022 | $4,747 | $235,228 | $0 | $0 |
| 2021 | $4,192 | $225,884 | $5,100 | $220,784 |
| 2020 | $3,795 | $194,404 | $4,800 | $189,604 |
| 2019 | $4,121 | $210,845 | $5,350 | $205,495 |
| 2018 | $1,590 | $110,282 | $0 | $0 |
| 2017 | $1,538 | $106,702 | $0 | $0 |
| 2016 | $1,500 | $104,507 | $0 | $0 |
| 2015 | $1,503 | $103,781 | $0 | $0 |
| 2014 | $1,426 | $102,957 | $0 | $0 |
Source: Public Records
Map
Nearby Homes
- 8509 SW 136th Loop
- 8525 SW 136th Loop
- 8434 SW 138th Place
- 13669 SW 81st Cir
- TBD SW 135th Loop
- 8151 SW 135th Loop
- 13552 SW 81st Cir
- 8776 SW 139th Place Rd
- 8272 SW 139th St
- 8445 SW 139th Lane Rd
- 8361 SW 135th Loop
- 8001 SW 135th Loop
- 13405 SW 86th Ave
- 8703 SW 135th Place
- 8182 SW 135th Street Rd
- 13736 SW 81st Cir
- 8007 SW 135th Loop
- TBD SW 135th Street Rd
- 0 SW 135th Street Rd Unit 20 MFRO6314911
- 8067 SW 135th Loop
- 8506 SW 136th Loop
- 8514 SW 136th Loop
- 8509 SW 136th Loop
- 8518 SW 136th Loop
- 8513 SW 136th Loop
- 8517 SW 136th Loop
- 8522 SW 136th Loop
- 8501 SW 136th Loop
- 8521 SW 136th Loop
- 8400 SW 136th Place
- 8497 SW 136th Loop
- 8494 SW 136th Loop
- 8372 SW 136th Place
- 8498 SW 136th Loop
- 8500 SW 136th Loop
- 8350 SW 136th Place
- 8428 SW 136th Place
- 8485 SW 136th Loop
- 8490 SW 136th Loop
- 8530 SW 136th Loop
Your Personal Tour Guide
Ask me questions while you tour the home.