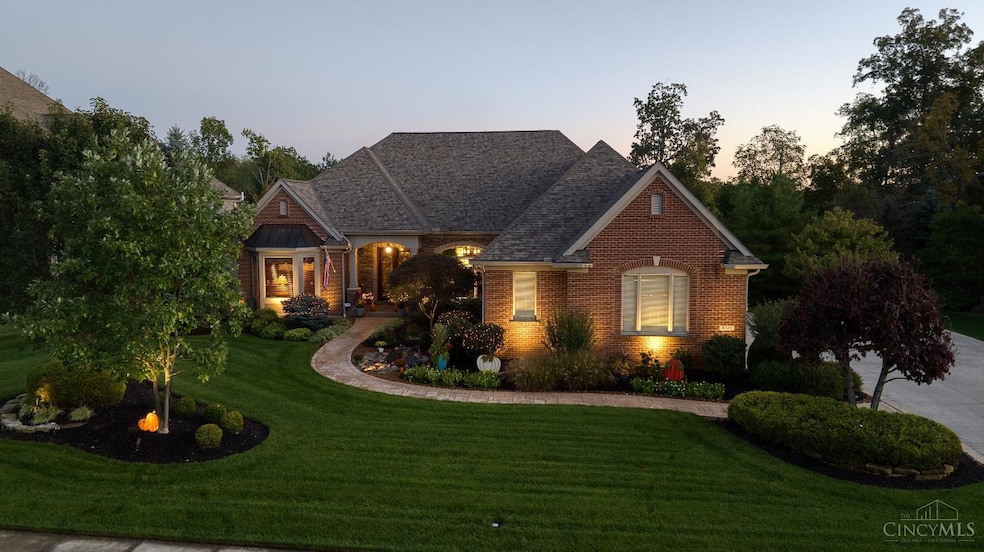
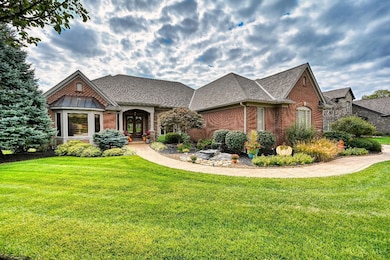
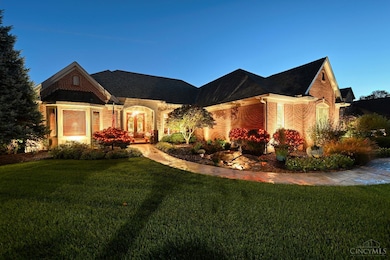
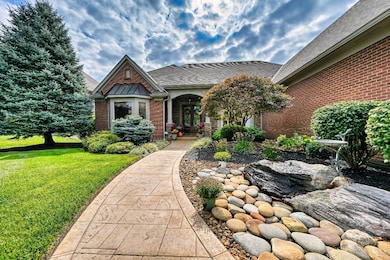
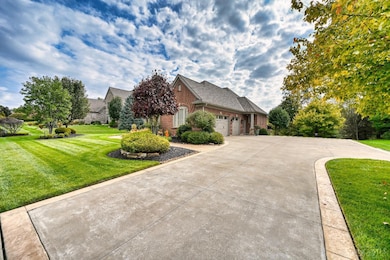
8511 Ivy Trails Dr Cincinnati, OH 45244
Dry Run NeighborhoodEstimated payment $7,541/month
Highlights
- Eat-In Gourmet Kitchen
- Deck
- Outdoor Fireplace
- Mercer Elementary School Rated A
- 2-Story Property
- Wood Flooring
About This Home
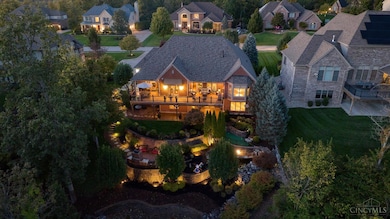
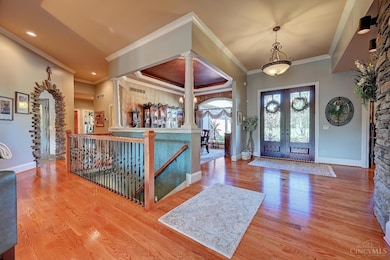
Stunning custom-built ranch by John Hueber offering over 4,500 sq ft of luxury living. The main level features a spacious owner's suite with custom stained-glass bath, a guest suite with ensuite, private study, formal dining room, and an open family room with gas fireplace and walkout to an expansive composite deck. The gourmet kitchen showcases Thermador/Sub-Zero appliances, double ovens, six-burner gas range, dual sinks, custom cabinetry, and new quartz countertops (2025). The walk-out lower level is perfect for entertaining with a wet bar, dishwasher, beverage cooler, 200-bottle wine cellar, two bedrooms, full bath, gas fireplace, and large storage room. Step outside to a professionally landscaped, terraced backyard featuring a putting green, wood-burning fireplace, and tranquil KOI pond. Meticulously maintained with new roof (2023), HVAC (2024), exterior paint (2024).Expansive storage space w/painted flr & built in work bench. The 3-car garage w/epoxy flrs & 8-zone surround sound
Home Details
Home Type
- Single Family
Est. Annual Taxes
- $16,992
Year Built
- Built in 2008
HOA Fees
- $90 Monthly HOA Fees
Parking
- 3 Car Garage
Home Design
- 2-Story Property
- Brick Exterior Construction
- Poured Concrete
- Shingle Roof
Interior Spaces
- 4,695 Sq Ft Home
- Wet Bar
- Insulated Windows
- Window Treatments
- Family Room with Fireplace
- Formal Dining Room
Kitchen
- Eat-In Gourmet Kitchen
- Double Oven
- Gas Cooktop
- Microwave
- Dishwasher
- Wine Cooler
- Quartz Countertops
- Solid Wood Cabinet
Flooring
- Wood
- Tile
Bedrooms and Bathrooms
- 4 Bedrooms
- Main Floor Bedroom
- Dual Vanity Sinks in Primary Bathroom
- Jetted Tub in Primary Bathroom
Laundry
- Dryer
- Washer
Finished Basement
- Walk-Out Basement
- Basement Fills Entire Space Under The House
Outdoor Features
- Deck
- Patio
- Outdoor Fireplace
Utilities
- Forced Air Heating and Cooling System
- Heating System Uses Gas
- Gas Water Heater
Map
Home Values in the Area
Average Home Value in this Area
Tax History
| Year | Tax Paid | Tax Assessment Tax Assessment Total Assessment is a certain percentage of the fair market value that is determined by local assessors to be the total taxable value of land and additions on the property. | Land | Improvement |
|---|---|---|---|---|
| 2024 | $16,992 | $279,962 | $55,405 | $224,557 |
| 2023 | $16,162 | $279,962 | $55,405 | $224,557 |
| 2022 | $14,370 | $221,673 | $55,405 | $166,268 |
| 2021 | $14,029 | $221,673 | $55,405 | $166,268 |
| 2020 | $14,191 | $221,673 | $55,405 | $166,268 |
| 2019 | $14,209 | $201,520 | $50,369 | $151,151 |
| 2018 | $13,308 | $201,520 | $50,369 | $151,151 |
| 2017 | $12,551 | $201,520 | $50,369 | $151,151 |
| 2016 | $14,116 | $221,484 | $40,611 | $180,873 |
| 2015 | $13,709 | $221,484 | $40,611 | $180,873 |
| 2014 | $13,718 | $221,484 | $40,611 | $180,873 |
| 2013 | $13,358 | $228,333 | $41,867 | $186,466 |
Property History
| Date | Event | Price | List to Sale | Price per Sq Ft |
|---|---|---|---|---|
| 11/03/2025 11/03/25 | Price Changed | $1,145,000 | -4.2% | $244 / Sq Ft |
| 10/15/2025 10/15/25 | For Sale | $1,195,000 | -- | $255 / Sq Ft |
Purchase History
| Date | Type | Sale Price | Title Company |
|---|---|---|---|
| Warranty Deed | $391,893 | Attorney | |
| Warranty Deed | $201,200 | None Available |
Mortgage History
| Date | Status | Loan Amount | Loan Type |
|---|---|---|---|
| Previous Owner | $2,500,000 | Unknown |
Source: MLS of Greater Cincinnati (CincyMLS)
MLS Number: 1858298
APN: 500-0060-0299
Disclaimer: Certain information contained herein is derived from information provided by parties other than Homes.com. All information provided is deemed reliable, but is not guaranteed to be accurate and should be independently verified.
![]() The data relating to real estate for sale on this website comes in part from the Broker Reciprocity programs of the MLS of Greater Cincinnati, Inc.. Those listings held by brokerage firms other than Ten-X are marked with the Broker Reciprocity logo and house icon. The properties displayed may not be all of the properties available through Broker Reciprocity.
The data relating to real estate for sale on this website comes in part from the Broker Reciprocity programs of the MLS of Greater Cincinnati, Inc.. Those listings held by brokerage firms other than Ten-X are marked with the Broker Reciprocity logo and house icon. The properties displayed may not be all of the properties available through Broker Reciprocity.
IDX information is provided exclusively for personal, non-commercial use, and may not be used for any purpose other than to identify prospective properties consumers may be interested in purchasing.
Information is deemed reliable but not guaranteed.
Ten-X does not display the entire Cincinnati MLS Broker Reciprocity™ database on this web site. The listings of some real estate brokerage firms have been excluded.
Copyright 2025, MLS of Greater Cincinnati, Inc. All rights reserved
- 2623 8 Mile Rd
- 4551 Dameron Ln
- 445 Ivy Trails Dr
- 8353 Bridle Rd
- 8385 Bridle Rd
- 2547 Teuton Ct
- 458 Maple Ridge Ct
- 4417 Wiborg Dr
- 453 Glenrose Ln
- 8217 Wycliffe Dr
- 4383 Wiborg Dr
- 472 Craig Rd
- 4669 Bluejacket Rd
- 2161 Knightsbridge Dr
- 439 Dartmouth Cir
- 4478 Bent Creek Dr
- 4603 Laurel View Dr
- 544 Forest Ridge Ct Unit 24
- 544 Forest Ridge Ct
- 499 Halifax Cir
- 484 Old State Route 74
- 533 Aspen Glen Dr Unit 311
- 540 Halifax Cir Unit 77
- 533 Aspen Glen Dr
- 4626 Laurel View Dr
- 539 Aspen Glen Dr Unit 427
- 640 Daniel Ct
- 4593 Summerside Rd
- 4620 Summerside Rd
- 4500 Long Acres Dr
- 4427 Aicholtz Rd
- 4380 Eastgate Blvd
- 300 Cardinal Dr
- 732 Clough Pike
- 860 Deerfield Blvd
- 7401 Pondview Place
- 4037 Mt Carmel Tobasco Rd
- 7911 Stonegate Dr
- 4835 Stoneybrook Rd
- 503 Stone Creek Way
