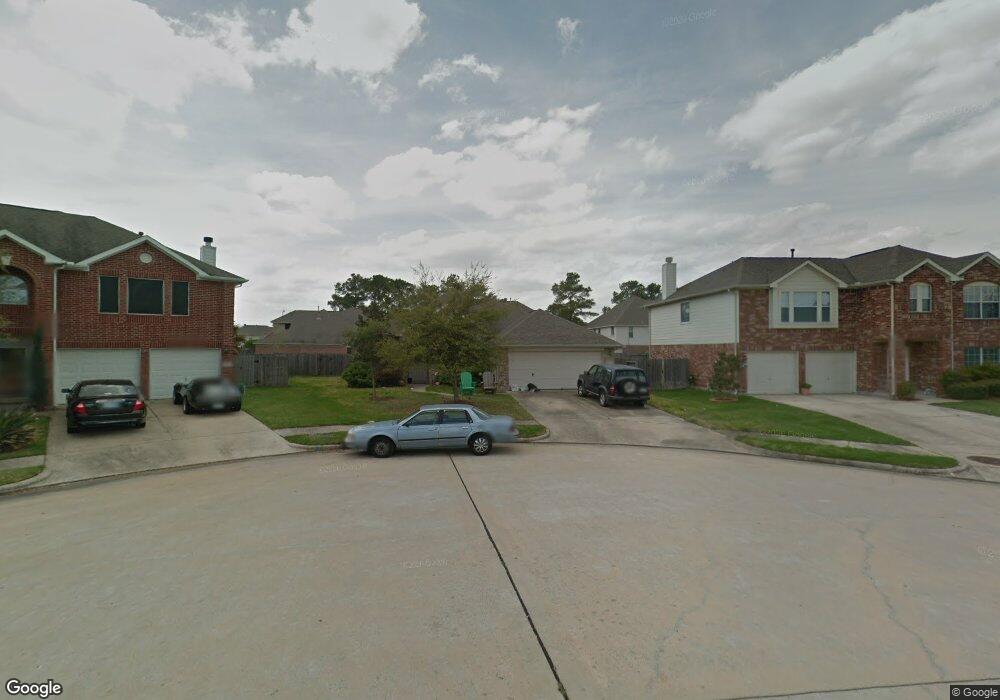
8511 Owen Lake Ct Houston, TX 77095
Copper Lakes NeighborhoodEstimated Value: $293,188 - $328,000
3
Beds
2
Baths
1,839
Sq Ft
$170/Sq Ft
Est. Value
About This Home
This home is located at 8511 Owen Lake Ct, Houston, TX 77095 and is currently estimated at $311,797, approximately $169 per square foot. 8511 Owen Lake Ct is a home located in Harris County with nearby schools including Copeland Elementary School, Aragon Middle School, and Langham Creek High School.
Ownership History
Date
Name
Owned For
Owner Type
Purchase Details
Closed on
Apr 22, 2022
Sold by
Hoang Kristi Q and Hoang Tony
Bought by
Nguyen Keith Ky
Current Estimated Value
Purchase Details
Closed on
Aug 22, 2012
Sold by
Wells Fargo Bank Na
Bought by
Hoang Kristi Q
Purchase Details
Closed on
Sep 6, 2011
Sold by
Hart John M and Hart Patricia
Bought by
Wells Fargo Bank Na
Purchase Details
Closed on
Aug 7, 2008
Sold by
Hart John M and Hart Patricia
Bought by
Copper Lakes Homeowners Association
Purchase Details
Closed on
Jun 9, 2003
Sold by
Royce Homes Lp
Bought by
Hart John M and Hart Patricia
Home Financials for this Owner
Home Financials are based on the most recent Mortgage that was taken out on this home.
Original Mortgage
$133,100
Interest Rate
10.4%
Mortgage Type
Purchase Money Mortgage
Create a Home Valuation Report for This Property
The Home Valuation Report is an in-depth analysis detailing your home's value as well as a comparison with similar homes in the area
Home Values in the Area
Average Home Value in this Area
Purchase History
| Date | Buyer | Sale Price | Title Company |
|---|---|---|---|
| Nguyen Keith Ky | -- | None Listed On Document | |
| Hoang Kristi Q | -- | Austion Title Company | |
| Wells Fargo Bank Na | $103,500 | None Available | |
| Copper Lakes Homeowners Association | $987 | None Available | |
| Hart John M | -- | Stewart Title Houston Div |
Source: Public Records
Mortgage History
| Date | Status | Borrower | Loan Amount |
|---|---|---|---|
| Previous Owner | Hart John M | $133,100 |
Source: Public Records
Tax History Compared to Growth
Tax History
| Year | Tax Paid | Tax Assessment Tax Assessment Total Assessment is a certain percentage of the fair market value that is determined by local assessors to be the total taxable value of land and additions on the property. | Land | Improvement |
|---|---|---|---|---|
| 2025 | $5,813 | $327,748 | $79,675 | $248,073 |
| 2024 | $5,813 | $262,660 | $79,675 | $182,985 |
| 2023 | $5,813 | $329,167 | $79,675 | $249,492 |
| 2022 | $6,764 | $280,727 | $56,911 | $223,816 |
| 2021 | $5,477 | $214,502 | $56,911 | $157,591 |
| 2020 | $4,746 | $179,138 | $40,650 | $138,488 |
| 2019 | $5,078 | $185,961 | $40,650 | $145,311 |
| 2018 | $2,304 | $160,000 | $40,650 | $119,350 |
| 2017 | $4,850 | $174,681 | $40,650 | $134,031 |
| 2016 | $4,850 | $174,681 | $40,650 | $134,031 |
| 2015 | $4,599 | $168,666 | $40,650 | $128,016 |
| 2014 | $4,599 | $160,000 | $40,650 | $119,350 |
Source: Public Records
Map
Nearby Homes
- 8410 Brighton Lake Ln
- 17531 Cypress Laurel St
- 8507 Forest Arbor Ct
- 8311 Brighton Lake Ln
- 8519 Sunrise Meadow Ln
- 17603 Fairgrove Park Dr
- 8803 Emerald Shore Ct
- 8823 Hollow Banks Ln
- 8535 Morning Oak Ln
- 17310 Crescent Canyon Dr
- 8902 Lilac Springs
- 17414 Jade Ridge Ln
- 9023 Cobble Falls Ct
- 17518 Rustling Aspen Ln
- 18114 Shallow Leaf Ln
- 8615 Debbie Terrace Dr
- 8215 Still Oak Ln
- 7918 Blue Wahoo Ln
- 17514 Raven Canyon Ln
- 8830 Debbie Terrace Dr
- 8515 Owen Lake Ct
- 8507 Owen Lake Ct
- 8514 Calverton Pines Ln
- 8518 Calverton Pines Ln
- 8519 Owen Lake Ct
- 8510 Calverton Pines Ln
- 8522 Calverton Pines Ln
- 8503 Owen Lake Ct
- 8523 Owen Lake Ct
- 8514 Owen Lake Ct
- 8526 Calverton Pines Ln
- 8506 Calverton Pines Ln
- 8502 Owen Lake Ct
- 8506 Owen Lake Ct
- 8518 Owen Lake Ct
- 8527 Owen Lake Ct
- 8522 Owen Lake Ct
- 8530 Calverton Pines Ln
- 17614 Cypress Laurel St
- 17618 Cypress Laurel St