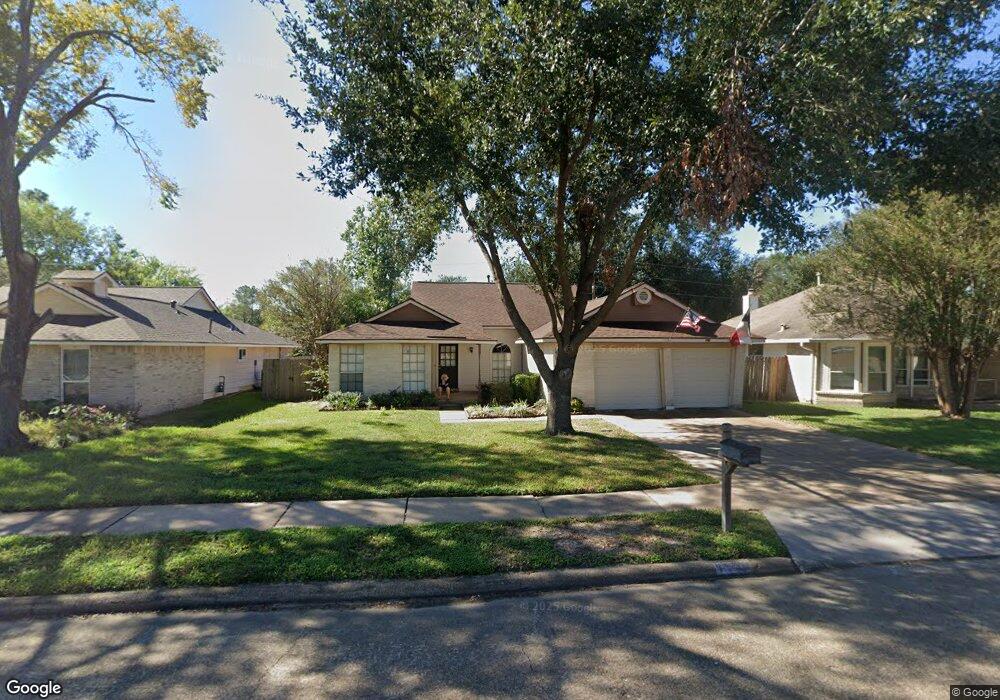
8511 Rose Manor Dr Houston, TX 77095
Estimated Value: $260,292 - $280,000
4
Beds
2
Baths
1,930
Sq Ft
$142/Sq Ft
Est. Value
About This Home
This home is located at 8511 Rose Manor Dr, Houston, TX 77095 and is currently estimated at $273,323, approximately $141 per square foot. 8511 Rose Manor Dr is a home located in Harris County with nearby schools including Fiest Elementary School, Labay Middle School, and Cypress Falls High School.
Ownership History
Date
Name
Owned For
Owner Type
Purchase Details
Closed on
Dec 8, 2009
Sold by
Baker Hugh
Bought by
Bader 1999 Trust
Current Estimated Value
Purchase Details
Closed on
Jul 18, 2003
Sold by
Cruz Herman and Cruz Martha
Bought by
Baker Hugh
Home Financials for this Owner
Home Financials are based on the most recent Mortgage that was taken out on this home.
Original Mortgage
$94,500
Interest Rate
5.15%
Mortgage Type
Purchase Money Mortgage
Purchase Details
Closed on
Mar 23, 1999
Sold by
Nordlund John M and Nordlund Suzanne H
Bought by
Defreitas Maximilian Josef and Defreitas Karen Lee
Home Financials for this Owner
Home Financials are based on the most recent Mortgage that was taken out on this home.
Original Mortgage
$68,000
Interest Rate
6.69%
Create a Home Valuation Report for This Property
The Home Valuation Report is an in-depth analysis detailing your home's value as well as a comparison with similar homes in the area
Home Values in the Area
Average Home Value in this Area
Purchase History
| Date | Buyer | Sale Price | Title Company |
|---|---|---|---|
| Bader 1999 Trust | -- | Star Tex Title Company 04 | |
| Baker Hugh | -- | Stewart Title Houston Divisi | |
| Defreitas Maximilian Josef | -- | Alamo Title |
Source: Public Records
Mortgage History
| Date | Status | Borrower | Loan Amount |
|---|---|---|---|
| Previous Owner | Baker Hugh | $94,500 | |
| Previous Owner | Defreitas Maximilian Josef | $68,000 |
Source: Public Records
Tax History Compared to Growth
Tax History
| Year | Tax Paid | Tax Assessment Tax Assessment Total Assessment is a certain percentage of the fair market value that is determined by local assessors to be the total taxable value of land and additions on the property. | Land | Improvement |
|---|---|---|---|---|
| 2025 | $1,186 | $249,724 | $56,531 | $193,193 |
| 2024 | $1,186 | $258,906 | $56,531 | $202,375 |
| 2023 | $1,186 | $246,590 | $56,531 | $190,059 |
| 2022 | $4,980 | $235,661 | $51,513 | $184,148 |
| 2021 | $4,842 | $185,029 | $51,513 | $133,516 |
| 2020 | $4,756 | $187,571 | $42,816 | $144,755 |
| 2019 | $4,453 | $159,711 | $27,764 | $131,947 |
| 2018 | $2,336 | $162,200 | $27,764 | $134,436 |
| 2017 | $4,523 | $162,200 | $27,764 | $134,436 |
| 2016 | $4,523 | $162,175 | $27,764 | $134,411 |
| 2015 | $2,418 | $146,013 | $27,764 | $118,249 |
| 2014 | $2,418 | $128,682 | $23,081 | $105,601 |
Source: Public Records
Map
Nearby Homes
- 15611 Meadow Village Dr
- 15414 Swan Creek Dr
- 15415 Swan Creek Dr
- 15634 Haleys Landing Ln
- 8526 Greenleaf Lake Dr
- 15362 Meadow Village Dr
- 15610 Tarpon Springs Ct
- 15339 Glenwood Park Dr
- 8211 Riverglade Dr
- 15610 Manorford Ct
- 15735 Jamie Lee Dr
- 15627 Kentwater Ct
- 8203 Green Devon Dr
- 8306 Lake Crystal Dr
- 8526 Hot Springs Dr
- 15954 Oak Mountain Dr
- 9303 Reston Grove Ln
- 15802 Aberdeen Trails Dr
- 9111 Baber Dr
- 8818 Apple Mill Dr
- 8515 Rose Manor Dr
- 8507 Rose Manor Dr
- 8519 Rose Manor Dr
- 8503 Rose Manor Dr
- 15606 Highfield Dr
- 15603 Highfield Dr
- 15515 Sungold Ct
- 15607 Highfield Dr
- 15514 Sungold Ct
- 15519 Swan Creek Dr
- 15614 Highfield Dr
- 8502 Rose Manor Dr
- 15511 Sungold Ct
- 15515 Swan Creek Dr
- 15510 Sungold Ct
- 15526 Meadow Village Dr
- 15615 Highfield Dr
- 8526 Rose Manor Dr
- 15618 Highfield Dr
- 15602 Meadow Village Dr