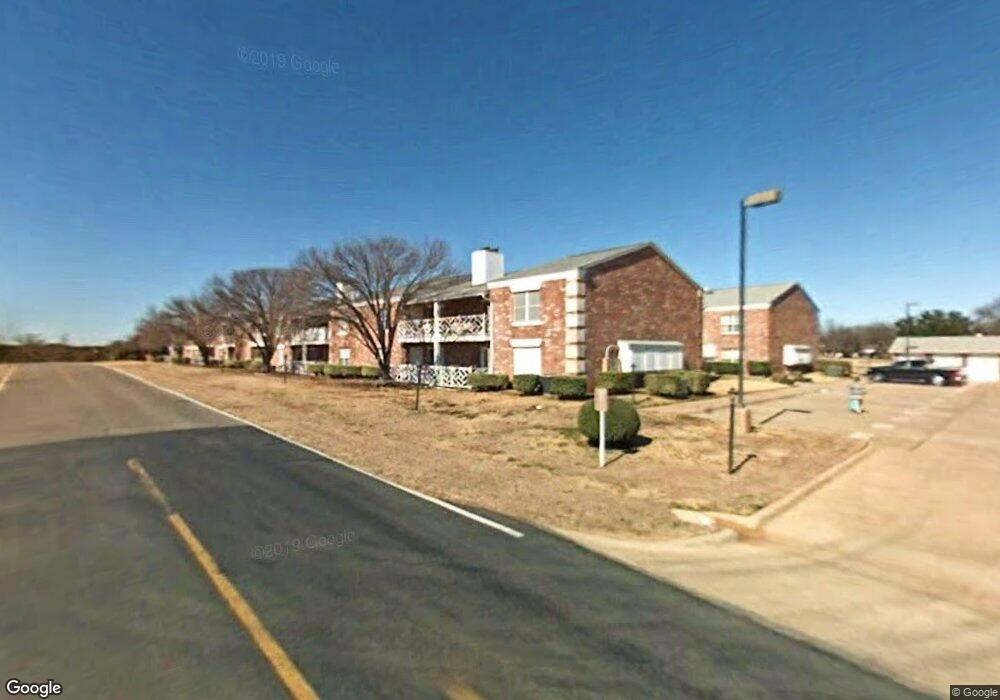
Fairway Condominiums 8511 Westover Ct Unit 128 Granbury, TX 76049
Estimated Value: $160,622 - $201,000
1
Bed
2
Baths
840
Sq Ft
$210/Sq Ft
Est. Value
About This Home
This home is located at 8511 Westover Ct Unit 128, Granbury, TX 76049 and is currently estimated at $176,656, approximately $210 per square foot. 8511 Westover Ct Unit 128 is a home located in Hood County with nearby schools including STEAM Academy at Mambrino, Granbury Middle School, and Granbury High School.
Ownership History
Date
Name
Owned For
Owner Type
Purchase Details
Closed on
Dec 1, 2020
Sold by
Grubbs Jerald and Grubbs Marilyn
Bought by
Mikulecky Joel and Mikulecky Diane
Current Estimated Value
Purchase Details
Closed on
Apr 22, 2014
Sold by
Stewart Mack
Bought by
Templeton David A and Cochran Leslea
Home Financials for this Owner
Home Financials are based on the most recent Mortgage that was taken out on this home.
Original Mortgage
$46,800
Interest Rate
4.43%
Mortgage Type
New Conventional
Purchase Details
Closed on
Aug 4, 2006
Sold by
Cantrell Karen Zell and Smith Eugene C
Bought by
Ballard Kay
Purchase Details
Closed on
Dec 24, 2003
Sold by
Smith Eugene C
Bought by
Templeton David A and Templeton Cochran Leslea
Purchase Details
Closed on
Dec 18, 2001
Sold by
Smith Eugene C
Bought by
Templeton David A and Templeton Cochran Leslea
Create a Home Valuation Report for This Property
The Home Valuation Report is an in-depth analysis detailing your home's value as well as a comparison with similar homes in the area
Home Values in the Area
Average Home Value in this Area
Purchase History
| Date | Buyer | Sale Price | Title Company |
|---|---|---|---|
| Mikulecky Joel | -- | Town Square Title | |
| Templeton David A | -- | Central Texas Title Luton | |
| Ballard Kay | -- | None Available | |
| Templeton David A | -- | -- | |
| Templeton David A | -- | -- |
Source: Public Records
Mortgage History
| Date | Status | Borrower | Loan Amount |
|---|---|---|---|
| Previous Owner | Templeton David A | $46,800 |
Source: Public Records
Tax History Compared to Growth
Tax History
| Year | Tax Paid | Tax Assessment Tax Assessment Total Assessment is a certain percentage of the fair market value that is determined by local assessors to be the total taxable value of land and additions on the property. | Land | Improvement |
|---|---|---|---|---|
| 2025 | $296 | $155,550 | $10,000 | $145,550 |
| 2024 | $328 | $145,332 | $10,000 | $142,390 |
| 2023 | $1,608 | $146,440 | $10,000 | $136,440 |
| 2022 | $1,052 | $135,870 | $5,000 | $130,870 |
| 2021 | $1,676 | $109,190 | $5,000 | $104,190 |
| 2020 | $1,458 | $93,870 | $5,000 | $88,870 |
| 2019 | $1,526 | $93,870 | $5,000 | $88,870 |
| 2018 | $1,514 | $93,130 | $5,000 | $88,130 |
| 2017 | $1,080 | $64,610 | $5,000 | $59,610 |
| 2016 | $950 | $56,810 | $5,000 | $51,810 |
| 2015 | $934 | $56,350 | $5,000 | $51,350 |
| 2014 | $934 | $56,350 | $5,000 | $51,350 |
Source: Public Records
About Fairway Condominiums
Map
Nearby Homes
- 8511 Westover Ct Unit 139
- 8511 Westover Ct Unit 217
- 5002 Elms Ct
- 8610 Leisure Ln
- 6236 Tezcuco Ct
- 5124 Wedgefield Rd
- 6103 Prospect Hill Dr
- 5133 Wedgefield Rd
- 6100 Cherokee Dr
- 6102 N Waverly Ct
- 6003 Oakwood Ct
- 6023 Melrose Cir
- 2715 Village Rd
- 2711 Village Rd
- 9003 Hickory Hill Dr
- 6521 Edgewood Ct
- 6304 Kenilworth Ct
- 9219 Hanging Moss Dr
- 8915 Bontura Rd
- 6210 Joseph Dr
- 8511 Westover Ct Unit 137
- 8511 Westover Ct Unit 240
- 8511 Westover Ct Unit 239
- 8511 Westover Ct Unit 238
- 8511 Westover Ct
- 8511 Westover Ct
- 8511 Westover Ct Unit 235
- 8511 Westover Ct Unit 234
- 8511 Westover Ct
- 8511 Westover Ct
- 8511 Westover Ct Unit 139
- 8511 Westover Ct Unit 138
- 8511 Westover Ct
- 8511 Westover Ct
- 8511 Westover Ct Unit 135
- 8511 Westover Ct Unit 134
- 8511 Westover Ct
- 8511 Westover Ct Unit 232
- 8511 Westover Ct Unit 231
- 8511 Westover Ct