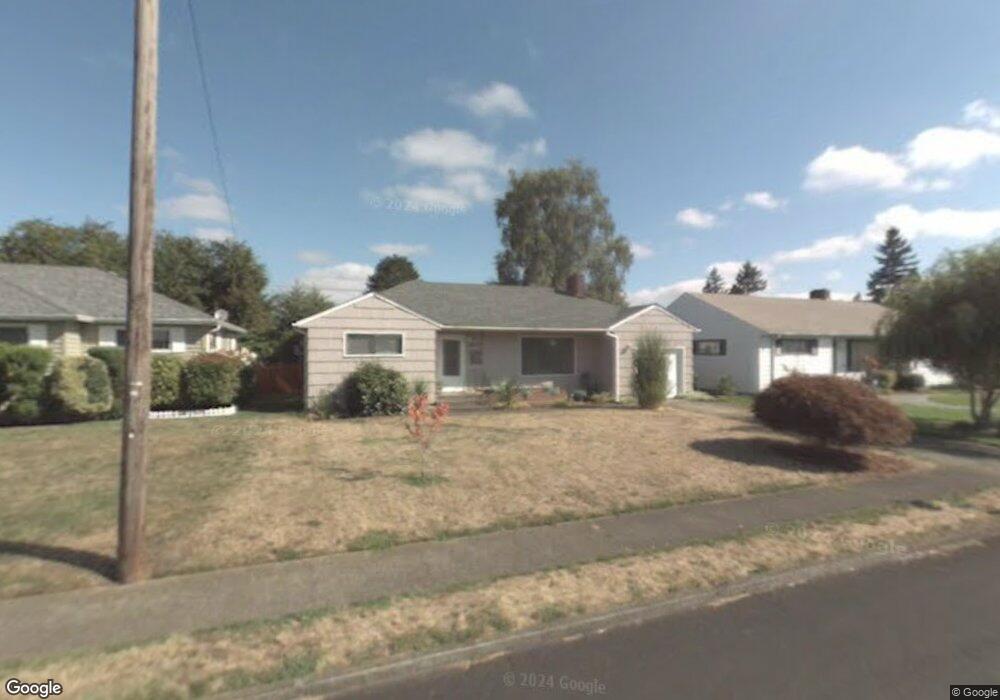
8512 Mt Thielsen Ave Vancouver, WA 98664
Vancouver Heights NeighborhoodEstimated Value: $402,000 - $418,000
3
Beds
1
Bath
1,207
Sq Ft
$338/Sq Ft
Est. Value
About This Home
This home is located at 8512 Mt Thielsen Ave, Vancouver, WA 98664 and is currently estimated at $407,600, approximately $337 per square foot. 8512 Mt Thielsen Ave is a home located in Clark County with nearby schools including George C. Marshall Elementary School, McLoughlin Middle School, and Fort Vancouver High School.
Ownership History
Date
Name
Owned For
Owner Type
Purchase Details
Closed on
Sep 18, 2003
Sold by
Hud
Bought by
Jones Karter D
Current Estimated Value
Home Financials for this Owner
Home Financials are based on the most recent Mortgage that was taken out on this home.
Original Mortgage
$96,000
Outstanding Balance
$44,718
Interest Rate
6.3%
Mortgage Type
Purchase Money Mortgage
Estimated Equity
$362,882
Purchase Details
Closed on
Jun 19, 2003
Sold by
Wells Fargo Home Mortgage Inc
Bought by
Hud
Purchase Details
Closed on
May 13, 2003
Sold by
Smith Eugenia A
Bought by
Wells Fargo Home Mortgage Inc
Purchase Details
Closed on
Jul 20, 2001
Sold by
Larsen Steve E
Bought by
Smith Eugenia A
Purchase Details
Closed on
May 28, 1997
Sold by
Weber Mildred M
Bought by
Larsen Steve E
Home Financials for this Owner
Home Financials are based on the most recent Mortgage that was taken out on this home.
Original Mortgage
$112,530
Interest Rate
8.13%
Mortgage Type
VA
Create a Home Valuation Report for This Property
The Home Valuation Report is an in-depth analysis detailing your home's value as well as a comparison with similar homes in the area
Home Values in the Area
Average Home Value in this Area
Purchase History
| Date | Buyer | Sale Price | Title Company |
|---|---|---|---|
| Jones Karter D | -- | First American Title | |
| Hud | -- | First American Title | |
| Wells Fargo Home Mortgage Inc | $133,388 | First American Title | |
| Smith Eugenia A | -- | Fidelity National Title | |
| Larsen Steve E | $110,324 | Charter Title Corp |
Source: Public Records
Mortgage History
| Date | Status | Borrower | Loan Amount |
|---|---|---|---|
| Open | Jones Karter D | $96,000 | |
| Previous Owner | Larsen Steve E | $112,530 | |
| Closed | Jones Karter D | $24,000 |
Source: Public Records
Tax History Compared to Growth
Tax History
| Year | Tax Paid | Tax Assessment Tax Assessment Total Assessment is a certain percentage of the fair market value that is determined by local assessors to be the total taxable value of land and additions on the property. | Land | Improvement |
|---|---|---|---|---|
| 2025 | $3,633 | $387,352 | $194,300 | $193,052 |
| 2024 | $3,536 | $371,840 | $194,300 | $177,540 |
| 2023 | $3,441 | $377,775 | $194,300 | $183,475 |
| 2022 | $3,185 | $369,104 | $194,300 | $174,804 |
| 2021 | $2,837 | $318,280 | $167,500 | $150,780 |
| 2020 | $2,583 | $267,255 | $121,073 | $146,182 |
| 2019 | $2,358 | $252,089 | $111,657 | $140,432 |
| 2018 | $2,473 | $238,378 | $0 | $0 |
| 2017 | $2,175 | $207,539 | $0 | $0 |
| 2016 | $1,970 | $190,518 | $0 | $0 |
| 2015 | $1,889 | $164,874 | $0 | $0 |
| 2014 | -- | $149,492 | $0 | $0 |
| 2013 | -- | $123,363 | $0 | $0 |
Source: Public Records
Map
Nearby Homes
- 8607 Mount Thielson Ave
- 9020 Boulder Ave
- 220 N Lieser Rd
- 300 Baltimore Way
- 8318 SE Middle Way
- 409 SE 95th Ave
- 8014 SE Middle Way
- 803 SE 94th Ave
- 1040 SE Columbia Ridge Dr Unit 2
- 410 SE 96th Ave
- 9012 Mt Lassen Ave
- 1323 SE Columbia Crest Ct
- 1504 SE 86th Ct
- 829 SE Morgan Rd
- 1511 SE 86th Ct
- 8015 SE Evergreen Hwy
- 410 SE 100th Ave
- 700 Garrison Terrace
- 1504 SE Hawks View Ct
- 1115 SE Morgan Rd
- 8508 Mt Thielsen Ave
- 8518 Mt Thielsen Ave
- 8500 Mt Thielsen Ave
- 8600 Mt Thielsen Ave
- 8508 Silver Star Ave
- 8515 Mt Thielsen Ave
- 8516 Silver Star Ave
- 8500 Silver Star Ave
- 8507 Mt Thielsen Ave
- 8519 Mt Thielsen Ave
- 8418 Mt Thielsen Ave
- 8608 Mt Thielsen Ave
- 8501 Mount Thielsen Ave
- 8501 Mt Thielsen Ave
- 8601 Mt Thielsen Ave
- 8600 Silver Star Ave
- 8416 Silver Star Ave
- 8412 Mt Thielsen Ave
- 8612 Mt Thielsen Ave
- 8419 Mt Thielsen Ave