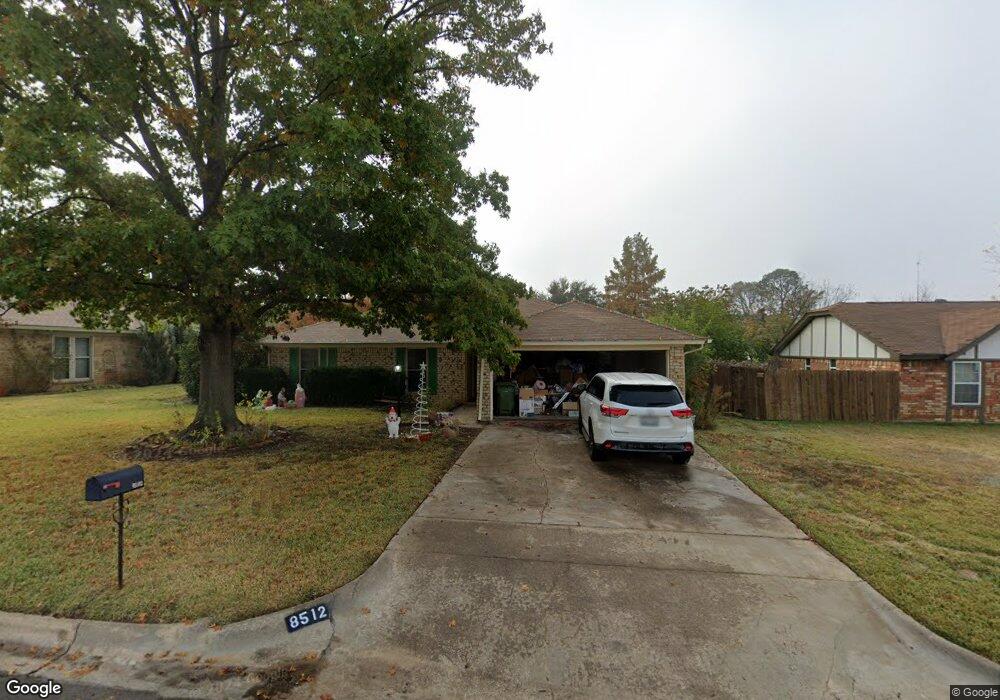
8512 Royal Ridge Dr North Richland Hills, TX 76182
Estimated Value: $318,829 - $335,000
3
Beds
2
Baths
1,370
Sq Ft
$237/Sq Ft
Est. Value
About This Home
This home is located at 8512 Royal Ridge Dr, North Richland Hills, TX 76182 and is currently estimated at $324,957, approximately $237 per square foot. 8512 Royal Ridge Dr is a home located in Tarrant County with nearby schools including Smithfield Elementary School, Smithfield Middle School, and Birdville High School.
Ownership History
Date
Name
Owned For
Owner Type
Purchase Details
Closed on
Jun 17, 2016
Sold by
Pratorius Karla Gayle
Bought by
Fox Karen
Current Estimated Value
Home Financials for this Owner
Home Financials are based on the most recent Mortgage that was taken out on this home.
Original Mortgage
$90,000
Outstanding Balance
$71,723
Interest Rate
3.61%
Mortgage Type
New Conventional
Estimated Equity
$253,234
Purchase Details
Closed on
May 5, 2015
Sold by
Riggs Nancy E
Bought by
Pratorius Karla Gayle
Home Financials for this Owner
Home Financials are based on the most recent Mortgage that was taken out on this home.
Original Mortgage
$58,913
Interest Rate
3.75%
Mortgage Type
FHA
Purchase Details
Closed on
Jul 17, 2012
Sold by
Riggs Robert K
Bought by
Riggs Nancy E
Purchase Details
Closed on
Jun 19, 2012
Sold by
Riggs Robert K
Bought by
Riggs Nancy E
Create a Home Valuation Report for This Property
The Home Valuation Report is an in-depth analysis detailing your home's value as well as a comparison with similar homes in the area
Home Values in the Area
Average Home Value in this Area
Purchase History
| Date | Buyer | Sale Price | Title Company |
|---|---|---|---|
| Fox Karen | -- | Freedom Title Company | |
| Pratorius Karla Gayle | -- | Rtc | |
| Riggs Nancy E | -- | None Available | |
| Riggs Nancy E | -- | None Available |
Source: Public Records
Mortgage History
| Date | Status | Borrower | Loan Amount |
|---|---|---|---|
| Open | Fox Karen | $90,000 | |
| Previous Owner | Pratorius Karla Gayle | $58,913 | |
| Closed | Riggs Nancy E | $0 |
Source: Public Records
Tax History Compared to Growth
Tax History
| Year | Tax Paid | Tax Assessment Tax Assessment Total Assessment is a certain percentage of the fair market value that is determined by local assessors to be the total taxable value of land and additions on the property. | Land | Improvement |
|---|---|---|---|---|
| 2025 | $2,808 | $290,426 | $60,000 | $230,426 |
| 2024 | $2,808 | $290,426 | $60,000 | $230,426 |
| 2023 | $5,801 | $272,689 | $60,000 | $212,689 |
| 2022 | $5,785 | $249,684 | $40,000 | $209,684 |
| 2021 | $5,561 | $221,065 | $40,000 | $181,065 |
| 2020 | $5,055 | $198,678 | $40,000 | $158,678 |
| 2019 | $5,130 | $200,002 | $40,000 | $160,002 |
| 2018 | $4,144 | $177,079 | $40,000 | $137,079 |
| 2017 | $4,458 | $165,675 | $40,000 | $125,675 |
| 2016 | $3,704 | $137,675 | $25,000 | $112,675 |
| 2015 | $2,626 | $124,820 | $25,000 | $99,820 |
| 2014 | $2,626 | $109,500 | $15,000 | $94,500 |
Source: Public Records
Map
Nearby Homes
- 7304 Davis Blvd
- 8417 Patricks Path
- 7216 Everglade Dr
- 8428 Hidden Creek Ct
- 9017 Rumfield Rd
- 8209 Spruce Ct
- 7404 Forrest Ln
- 7317 Hialeah Cir W
- 7104 Melissa Ct
- TBD Kirk Ln
- 8966 Hialeah Cir S
- 8412 Timberline Ct
- 8440 Stephanie Dr
- 8505 Scottie St
- 8424 Witt St
- 7321 Fallen Oak Dr
- 8048 Green Valley Dr
- 7209 Coventry Cir
- 7036 Crabtree Ln
- 7120 Payte Ln
- 8516 Royal Ridge Dr
- 8508 Royal Ridge Dr
- 7329 Stonedale Ct
- 8504 Royal Ridge Dr
- 8520 Royal Ridge Dr
- 7328 Stonedale Ct
- 7325 Stonedale Ct
- 8524 Royal Ridge Dr
- 7336 Stonybrooke Dr
- 7332 Stonybrooke Dr
- 7328 Stonybrooke Dr
- 7321 Stonedale Ct
- 7341 Meadowbrook Dr
- 7345 Meadowbrook Dr
- 7324 Stonybrooke Dr
- 7320 Stonedale Ct
- 7333 Meadowbrook Dr
- 7329 Meadowbrook Dr
- 7317 Stonedale Ct
- 7320 Stonybrooke Dr