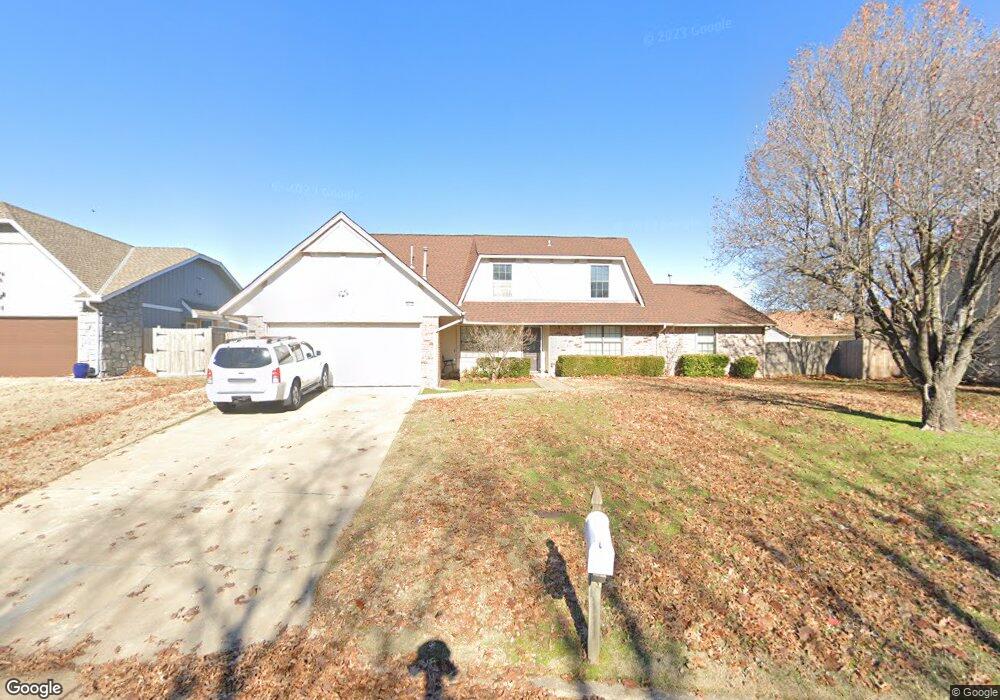
8513 E 75th St Tulsa, OK 74133
Woodlands NeighborhoodEstimated Value: $318,922 - $331,000
4
Beds
3
Baths
3,064
Sq Ft
$105/Sq Ft
Est. Value
About This Home
This home is located at 8513 E 75th St, Tulsa, OK 74133 and is currently estimated at $322,231, approximately $105 per square foot. 8513 E 75th St is a home located in Tulsa County with nearby schools including Jarman Elementary School, Union 6th-7th Grade Center, and Union 8th Grade Center.
Ownership History
Date
Name
Owned For
Owner Type
Purchase Details
Closed on
Mar 11, 2005
Sold by
Bernheimer Susan Vanessa and Bernheimber Susan V
Bought by
Bimba Elizabeth T
Current Estimated Value
Home Financials for this Owner
Home Financials are based on the most recent Mortgage that was taken out on this home.
Original Mortgage
$158,746
Outstanding Balance
$79,671
Interest Rate
5.66%
Mortgage Type
FHA
Estimated Equity
$242,560
Purchase Details
Closed on
Aug 31, 2004
Sold by
Bernheimer Craig
Bought by
Bernheimber Susan V
Purchase Details
Closed on
Jun 9, 2000
Sold by
Lazard Lori A and Lazard Ronald
Bought by
Bernheimer Craig and Bernheimer Susan V
Home Financials for this Owner
Home Financials are based on the most recent Mortgage that was taken out on this home.
Original Mortgage
$125,000
Interest Rate
8.3%
Mortgage Type
Purchase Money Mortgage
Purchase Details
Closed on
Feb 20, 1998
Sold by
Willis Joseph L and Willis Carolyn S
Bought by
Lazard Lori A
Create a Home Valuation Report for This Property
The Home Valuation Report is an in-depth analysis detailing your home's value as well as a comparison with similar homes in the area
Home Values in the Area
Average Home Value in this Area
Purchase History
| Date | Buyer | Sale Price | Title Company |
|---|---|---|---|
| Bimba Elizabeth T | $160,000 | Tulsa Abstract & Title Co | |
| Bernheimber Susan V | -- | -- | |
| Bernheimer Craig | $160,000 | Firstitle & Abstract Svcs In | |
| Lazard Lori A | $103,500 | Tulsa Abstract & Title Compa |
Source: Public Records
Mortgage History
| Date | Status | Borrower | Loan Amount |
|---|---|---|---|
| Open | Bimba Elizabeth T | $158,746 | |
| Previous Owner | Bernheimer Craig | $125,000 |
Source: Public Records
Tax History
| Year | Tax Paid | Tax Assessment Tax Assessment Total Assessment is a certain percentage of the fair market value that is determined by local assessors to be the total taxable value of land and additions on the property. | Land | Improvement |
|---|---|---|---|---|
| 2025 | $3,555 | $25,996 | $2,640 | $23,356 |
| 2024 | $3,015 | $24,757 | $2,605 | $22,152 |
| 2023 | $3,015 | $23,578 | $2,695 | $20,883 |
| 2022 | $2,992 | $22,456 | $3,404 | $19,052 |
| 2021 | $2,886 | $21,387 | $3,242 | $18,145 |
| 2020 | $2,778 | $20,890 | $3,167 | $17,723 |
| 2019 | $2,739 | $19,895 | $3,016 | $16,879 |
| 2018 | $2,602 | $18,947 | $3,222 | $15,725 |
| 2017 | $2,493 | $18,046 | $3,069 | $14,977 |
| 2016 | $2,438 | $18,046 | $3,069 | $14,977 |
| 2015 | $2,464 | $18,046 | $3,069 | $14,977 |
| 2014 | $2,366 | $17,600 | $3,069 | $14,531 |
Source: Public Records
Map
Nearby Homes
- 7440 S 86th East Ave
- 8410 E 74th Ct
- 7409 S 84th East Ave
- 8126 E 74th Ct
- 8507 E 78th St
- 8509 E 78th Place
- 7830 S 85th East Ave
- 7932 S 86th East Ave
- 7912 S 87th East Ave
- 7936 S 90th East Ave
- 7606 E 77th St
- 7944 S 90th Ave E
- 8007 S 88th East Ave
- 7802 E 79th St
- 7412 S 94th East Ave
- 8323 E 81st Place
- 6915 S 77th East Ave
- 9534 E 76th St
- 8019 S 77th East Ave
- 6760 S 78th East Ave
- 8507 E 75th St
- 8519 E 75th St
- 7434 S 86th East Ave
- 8420 E 74th Ct
- 7428 S 86th East Ave
- 8425 E 75th St
- 8508 E 75th St
- 8418 E 74th Ct
- 8416 E 74th Ct
- 7440 S 86th Ave E
- 7504 S 85th East Place
- 8525 E 75th St
- 8414 E 74th Ct
- 7511 S 85th East Ave
- 8412 E 74th Ct
- 8417 E 75th St
- 7422 S 86th East Ave
- 7511 S 85th East Ave
- 7415 S 85th East Ave
- 8416 E 75th St
Your Personal Tour Guide
Ask me questions while you tour the home.